#XRP is forming a symmetrical triangle pattern! #XRP is forming a symmetrical triangle pattern!
We expect a strong bounce once it breaks out. 🚀
Keep an eye on this setup—it could be a great opportunity!
DYOR, NFA
#Crypto #BullRun2025 #Altseason
Buyopportunity

Major Price Movement Incoming for NVDA!Signalist has detected a precise pattern in NASDAQ:NVDA trading activity, signaling that a substantial price movement is imminent. This isn’t a random fluctuation—it’s a carefully analyzed precursor to a significant market event.
📅 What to Expect:
⌛ Timeline: Anticipate a major move within the next 1 to 4 upcoming 3-hour candles.
📈 Monitor the Charts: Keep an eye on NVDA’s price action over the next few candles.
Prepare Your Strategy: Whether you’re bullish or bearish, have your trading plan ready to capitalize on the move.
🔍 Observations:
Delta (+385.39K):
This is a very large positive delta, indicating significant buying dominance during this candle.
Buyers were much more aggressive than sellers, as reflected by the delta and overall volume distribution.
Total Volume (1.73M):
This is an extremely high volume, suggesting the candle occurred during a highly active session (possibly a news-driven event or significant market participation).
High volume with a strong positive delta typically signals strong buying interest and momentum.
Volume Distribution:
Buy Volume (1.06M) overwhelms Sell Volume (672.02K) .
Significant buy imbalances are evident at all levels:
At the mid-level: 451.73K (buy) vs. 271.14K (sell).
At the lower level: 71.42K (buy) vs. 65.81K (sell).
This shows that buyers were active across all price ranges, with sellers unable to contain the upward momentum.
Candle Structure:
The candle is green, closing near the top of its range, indicating strong upward pressure.
This suggests that buyers not only dominated but also maintained control throughout the session.
High-Probability Outcome:
Given the data, the high probability outcome is a continuation of bullish momentum:
The high positive delta, strong buy volume, and green candle closing near the highs indicate that buyers are firmly in control.
With such overwhelming buying pressure, the market is likely to see further upward movement in subsequent candles.

atom long longterm"🌟 Welcome to Golden Candle! 🌟
We're a team of 📈 passionate traders 📉 who love sharing our 🔍 technical analysis insights 🔎 with the TradingView community. 🌎
Our goal is to provide 💡 valuable perspectives 💡 on market trends and patterns, but 🚫 please note that our analyses are not intended as buy or sell recommendations. 🚫
Instead, they reflect our own 💭 personal attitudes and thoughts. 💭
Follow along and 📚 learn 📚 from our analyses! 📊💡"

"INJ support at $17.30-$18.30, potential reversal to $27-$45." INJ/USDT Detailed Chart Analysis and Trade Plan
This analysis aims to provide an in-depth view of the current market structure for INJ/USDT, highlighting a potential reversal zone and long-term upside targets.
---
#1. Current Market Structure Analysis
- Support Zone: $17.30 - $18.30
- This range aligns with a visible **Fair Value Gap (FVG)** and a potential **bullish order block** from historical price action.
- INJ has consolidated around this zone, indicating a strong **buying interest** from previous liquidity sweeps.
- Why is this important?
- FVGs are areas where price has moved rapidly, often leaving inefficiencies that the market tends to revisit. Coupled with the order block, it strengthens the probability of reversal.
- RSI Oversold Signal:
- The **Relative Strength Index (RSI)** is at **38.49**, nearing oversold levels. Historically, bounces occur when RSI enters this zone, indicating that sellers may lose momentum.
- EMA Levels (Resistance):
- The **50 EMA ($23.62)** and **200 EMA ($23.52)** are acting as resistance. A breakout above these levels would likely confirm a stronger bullish reversal.
---
2. Reversal and Upside Targets
- Take Profit Levels:
- Target 1 (TP1): $27.30
- This corresponds to a prior liquidity zone where sell-side pressure emerged. Price may face resistance here before breaking higher.
- Target 2 (TP2): $35.00
- This level aligns with a significant **swing high** and an untested order block, providing a more ambitious long-term target.
-Target 3 (tp3) :45$-50$ for long term .
---
3. Key Levels and Trade Setup
| **Zone** | **Price Range** | **Action** |
|-----------------------|------------------|--------------------------|
| **Support Zone** | $17.30 - $18.30 | Look for long entries |
| **Stop Loss (SL)** | Below $16.80 | Risk management |
| **Take Profit 1 (TP1)** | $27.30 | Partial exit |
| **Take Profit 2 (TP2)** | $35.00 | Final exit |
**Position Scaling** | Add $45-$50 near confirmation signals to build a stronger position |
---
4. Sentiment and Fundamental Factors
- Injective Protocol's Key Strengths:
- Known for **high-performance Layer 1 blockchain** optimized for DeFi and decentralized exchange (DEX) applications.
- Recently, INJ has seen increased adoption with features like **decentralized perpetuals**, cross-chain bridging, and seamless liquidity.
- Bullish Catalysts to Watch:
- Ecosystem Growth: Partnerships or developments in **DeFi adoption** and higher trading volumes on Injective-based DEXs.
- Protocol Upgrades: Any enhancements that improve the scalability, security, or interoperability of the platform.
- Macro Market Trends: Bullish momentum in the broader crypto market could act as a tailwind for INJ.
---
5. Risk Management
- Entry Precision:
- Set limit orders near $17.30–$18.30 to capture entries at optimal levels.
- Risk/Reward Ratio:
- Assuming a stop loss at $16.80 and TPs at $27.30/$35.00, the
-risk/reward ratio exceeds 3:1, offering a favorable trade setup.
6. Final Notes
This trade is structured around the following:
- Strong confluence of technical indicators.
- Positive sentiment in the **DeFi space**.
- Potential for a broader crypto market rally.
If the price holds above the $17.30–$18.30 zone and breaks the EMAs, the likelihood of a bullish breakout increases significantly.

Major Price Movement Incoming for BA!Signalist has detected a precise pattern in BA's trading activity, signaling that a substantial price movement is imminent. This isn’t a random fluctuation—it’s a carefully analyzed precursor to a significant market event.
📅 What to Expect:
⌛ Timeline: Anticipate a major move within the next 1 to 4 upcoming 3-hour candles.
📈 Monitor the Charts: Keep an eye on BA’s price action over the next few candles.
Prepare Your Strategy: Whether you’re bullish or bearish, have your trading plan ready to capitalize on the move.

Major Price Movement Incoming for CVX!Signalist has detected a precise pattern in NYSE:CVX trading activity, signaling that a substantial price movement is imminent. This isn’t a random fluctuation—it’s a carefully analyzed precursor to a significant market event.
📅 What to Expect:
⌛ Timeline: Anticipate a major move within the next 1 to 4 upcoming 3-hour candles.
📈 Monitor the Charts: Keep an eye on CVX’s price action over the next few candles.
Prepare Your Strategy: Whether you’re bullish or bearish, have your trading plan ready to capitalize on the move.

#Ethereum Alert: Breakout Ahead!🚀 #Ethereum Chart Analysis: Potential Breakout Ahead!
Take a look at the symmetrical triangle forming on the CRYPTOCAP:ETH chart.
The price is consolidating within converging trendlines, signalling a potential breakout on the horizon.
🔥 Key Levels to Watch:
Support: ~$3,200
Resistance: ~$3,500
With the current price action, we could be approaching a decisive move. The big question: Will CRYPTOCAP:ETH break upwards or downwards? 🤔
Whatever CRYPTOCAP:ETH does, most of the #alts will follow.
Stay sharp, traders! Watch for volume spikes and confirmation before making moves.
Let us know your predictions below! 👇
DYOR. NFA
#Crypto

Possible BUY TREND CONTINUATION TRADE IDEA60/15mins TF TRADE IDEA
Looking forward to a buying setup still an idea at the moment.
From 60mins TF, buyers dominating the market and came to temporal hault. From 15mins TF, I see a correction and buyers showing sign of stepping in to resume LONG. The recent lower high has been challenged and waiting for a higher low as buy confirmation on the BUY TRADE IDEA .
Note: IF price continues short- making brand new lower low then the idea becomes invalid.
Looking fow

linkusdt buy"🌟 Welcome to Golden Candle! 🌟
We're a team of 📈 passionate traders 📉 who love sharing our 🔍 technical analysis insights 🔎 with the TradingView community. 🌎
Our goal is to provide 💡 valuable perspectives 💡 on market trends and patterns, but 🚫 please note that our analyses are not intended as buy or sell recommendations. 🚫
Instead, they reflect our own 💭 personal attitudes and thoughts. 💭
Follow along and 📚 learn 📚 from our analyses! 📊💡"

Tata power, good buy for long term and short term Tata power one of the best best fundamental stock now available at good demand zone one can add in portfolio if not added yet
Can add at levels of 380-405
Sl mclbs 365
Tgt atleast:1:2 & 25% to 100% expecting a blast before a Indian budget
Ask your financial advisor and broker before buying
Only for educational purposes

EUR/USD (SMC) concept+fib expansion!⭐EUR/USD has been in a strong downtrend, surpassing one of the last strongly confirmed supports, which makes me think that it will tend to retest this area from 1.03550, defying the continuation of the trend
⭐Before this retest of the support, my opinion is that it will go back down to the POI (point of interest) also called the strong demand zone
⭐Without much explanation in case the price does not test that POI I will automatically enter buy after confirmation that he will no longer retest that area
Inputs if retest POI: Inputs if doesn't retest POI:
Entry Price : 1.02650 Entry Price : 1.03200
Stop Loss: 1.02400 Stop Loss : 1.0300
Take Profit 1: 1.03100 Take Profit 1: 1.03100
Take Profit 2: 1.03550 Take Profit 2: 1.03550
Take Profit 3: 1.04000 (risky) Take Profit 3: 1.04000 (risky)

Amazon: Ready to Explode in 2025! 40% UPSIDECHARTURDAY - NASDAQ:AMZN Ready to Explode in 2025!
A great fundamental and technical setup for 2025!
-Multi-year CupnHandle with successful retest and we haven't realized the measured move yet
-Green H5 indicator
-Volume shelf w/ free space
-Williams CB is thriving
Pulled back to 9ema and previous resistance to flip into support and bounced.
🎯$231🎯$280 🎯$310
Not financial advice

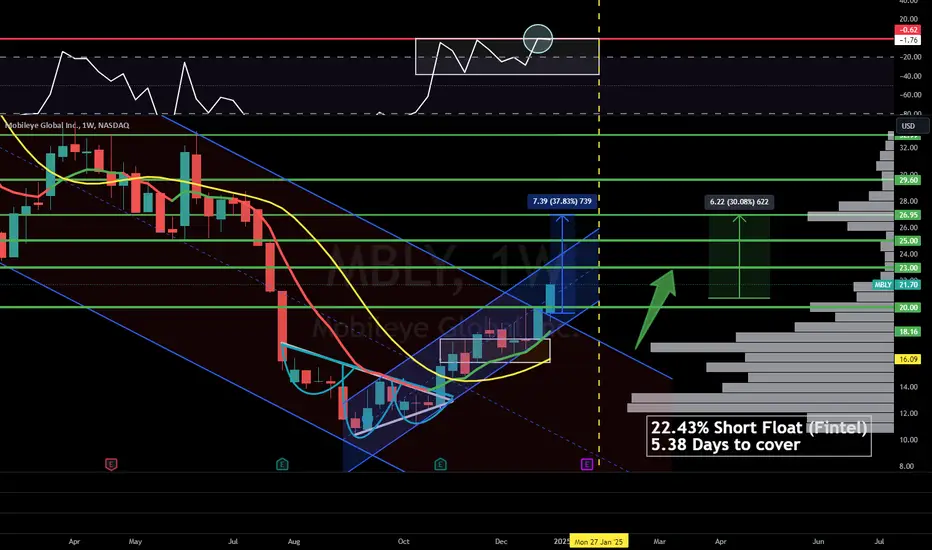
Unlocking the Secrets of $MBLY: Prepare for a MONSTER MOVE!NASDAQ:MBLY - A chapter out of my Book!🚘😂
MASSIVE MOVE ON FRIDAY!
What I'm seeing, we are smashing into the Red Barrier of my Williams CB strategy which means we need to peel off it! Well if we really do get that Honda news on Tuesday that only leaves Monday to have a pullback before we would have the monster move from the news then short-squeeze that week.
I've honestly never been in this predicament with a stock running into the barrier. I really believe that if we don't pullback Monday and get the Honda news on Tuesday we will bust right through this red barrier and it won't even matter which I've never seen a stock break through that red barrier before so I mean that's how BULLISH I am lol.
As far as the charts there are no other charts on this planet as SEXY as MOBILEYE!!!
Weekly chart:
- H5 is GREEN
- Broke out of downtrend and up trending with room up to $25 and I also believe we could bust through the top of this channel if we get the Honda news which will start the short squeeze! (Short Squeezes are rare and when you have them they defy gravity!)
-Williams CB is thriving
-Launched off volume shelf into volume GAP! Have room to $27 then another massive GAP!
Daily chart:
- CupnHandle Pattern breakout with successful retest
- Volume shelf launch with GAP
-Williams CB is formed and thriving
-Volume is increasing
-Massive measured move
I'M NOT KIDDING I COULD LITERALLY WRITE A DAMN BOOK ON MOBILEYE WITH HOW BULLISH I AM!
IT WILL BE CALLED THE MOBILEYE MILLIONAIRE!😂
Fundamentals are phenomenal:
-Revenues and margins troughed
-All head winds becoming tailwinds (Inflation, China, Interest rates)
2025 Price Target of $45
TA Targets:
🎯$23🎯$25🎯$27 🎯30
If you are still here reading this you better share this! 😂
Okay I have to get to other charts that's all for now on Mobileye friends!
Not financial advice
#Manta will go massive in this bull run!#Manta
Manta Network is revolutionizing the web3 space with its modular ecosystem. Built for speed and privacy, Manta offers faster transactions than Layer 1 and cheaper fees than Layer 2 solutions. With its zero-knowledge technology and a native token (MANTA) for rewards, it’s creating a vibrant, community-driven platform.
Our strategy for #MANTA is to accumulate during price consolidations, aiming to take advantage of growth potential in the future. With a mid-market cap and potential for volatility, MANTA represents a strong opportunity for long-term growth.
The accumulation zone for MANTA is $1–$0.80.
DYOR, NFA

"STG/USDT targets $2-$5 amid bullish momentum and Vitalik buzz!
Chart Analysis:
1. Current Price: STG is trading at $0.4167, above the 50-day EMA ($0.3561) and the 200-day EMA ($0.3695), indicating a short-term bullish trend.
2. Key Resistance Levels:
- $0.5662: Immediate resistance, as it marks a previous price reaction zone.
- $0.7293: A critical level to breach for bullish momentum continuation.
- $0.8782: Strong resistance zone before entering the $1 range.
3. Volume: Recent spikes in volume suggest increased buying interest.
4. Potential Upside Targets:
- $2: A significant psychological and technical resistance, requiring a breakout above $0.8782 and consistent volume.
- $3: Mid-term target, achievable if $2 holds as support.
- $5: A long-term target, contingent on a sustained macroeconomic and market-wide crypto rally.
Vitalik Buterin's Involvement:
Recent reports about Vitalik Buterin's mention or potential association with STG might fuel speculative interest, leading to increased buying pressure. His name often correlates with trust and excitement in the crypto community. However, without clear confirmation or significant utility driven by his involvement, this may remain speculative.
Conclusion:
- Short Term: Watch for a breakout above $0.5662 and sustained volume.
- Mid to Long Term: Achieving $2, $3, and $5 depends on broader market conditions, ecosystem development, and concrete news about Buterin's role.

EUR USD BUY Entry Setup 1 hour timeframe EUR USD is bouncing from a support level after forming a Double Bottom Pattern.
DXY US dollar Index is also dropping from a supply level after forming a Double Top Pattern.
This trade is targeted to a RR: 1:2 - 1:3

Breakout incoming!$USUAL is consolidating within a symmetrical triangle and nearing a breakout point. A successful breakout could push the price toward $2.20, representing a potential 70% upside.
Keep an eye on the breakout for confirmation and volume for the next big move!
DYOR, NFA
#Crypto #USUAL #Altcoins

SWING IDEA - POLYPLEXNSE:POLYPLEX has hit its 3 year low of 800 levels recently. At this zone, it can been that while the Price Action has been making Lower Low Pattern, the MACD however is starting to form a Higher High Pattern.
This MACD Higher Higher Pattern the recent crossover as well indicates a move in the upward direction.
Follow Strict Stop Loss here as any weekly closing below the Swing Low levels can only take the stock further downward.
This could potentially be a High Risk High Reward Trade. Take it only based on your Risk Appetite and Management.

#GOLD UPDATE CHART READ INSTRECTIONIf the XAUUSD market rises and touches the level of 2621, it indicates a strong signal to enter a long position, anticipating further upward movement. Conversely, if the market drops and reaches the level of 2609, it serves as a confirmation to initiate a sell position, suggesting potential downward momentum.

COMMENT THE COIN NAME, AND I’LL DO ANALYSIS! Hey everyone,
If you're stuck on a coin or facing a loss, just COMMENT me the name, and I'll handle the analysis for you! 🔍

PIXEL/USDT Long Opportunity!NGM:PIXEL
USDT Long Setup
PIXEL is currently retesting a significant support zone marked by the green box and aligning with key levels such as the Fib retracement and the moving averages (MA). The price action shows a correction after hitting the $0.3067 high, but bullish momentum may resume if the support holds.
Entry Range: CMP TO $0.2
Targets:
T1: $0.2580
T2: $0.3067
T3: $0.4783
Stop Loss (SL): $0.183
DYOR, NFA

Bitcoin's Next Move?#Bitcoin is trading within an ascending triangle!
A breakout from this pattern could lead to a significant move, so keep a close eye on it.
Stay tuned for more updates.
DYOR, NFA

bch bitcoin cash bchusdt"🌟 Welcome to Golden Candle! 🌟
We're a team of 📈 passionate traders 📉 who love sharing our 🔍 technical analysis insights 🔎 with the TradingView community. 🌎
Our goal is to provide 💡 valuable perspectives 💡 on market trends and patterns, but 🚫 please note that our analyses are not intended as buy or sell recommendations. 🚫
Instead, they reflect our own 💭 personal attitudes and thoughts. 💭
Follow along and 📚 learn 📚 from our analyses! 📊💡"
