TMUS T-Mobile US Options Ahead of EarningsIf you haven`t bought TMUS before the rally:
Now analyzing the options chain and the chart patterns of TMUS T-Mobile US prior to the earnings report this week,
I would consider purchasing the 227.5usd strike price Puts with
an expiration date of 2025-7-25,
for a premium of approximately $3.50.
If these options prove to be profitable prior to the earnings release, I would sell at least half of them.
Disclosure: I am part of Trade Nation's Influencer program and receive a monthly fee for using their TradingView charts in my analysis.
Buysell

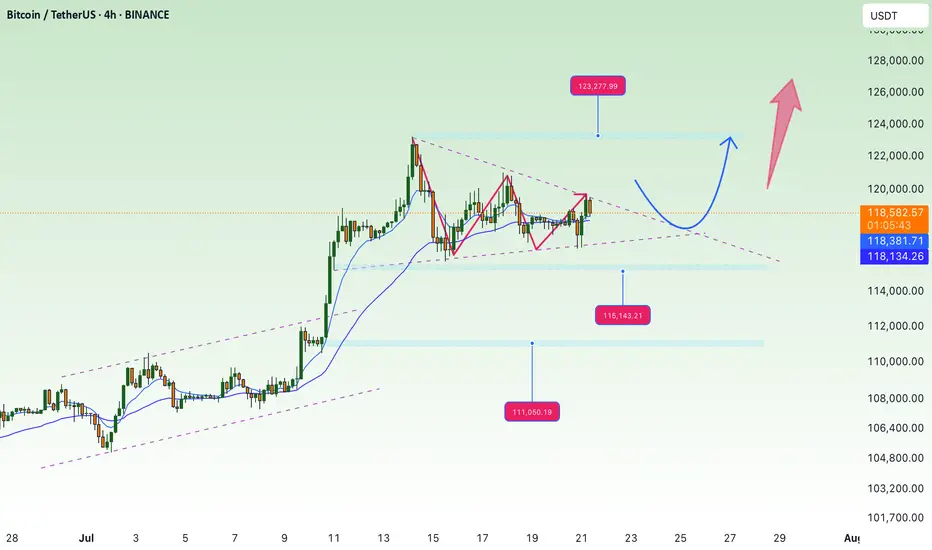
accumulate, continue to aim for new ATH💎 Update Plan BTC (July 21)
Notable news about BTC
CEO of Charles Schwab, Rick Wurster, said the company plans to deploy Bitcoin and Ethereum transactions for customers.
This company aims to compete with Coinbase, where customers buy BTC.
This development takes place after the progress of cryptocurrencies when President Donald Trump signs the Genius bill into law.
In an interview on Friday, the CEO of Charles Schwab, Rick Wurster, said the company plans to launch Bitcoin (BTC) and Ethereum (ETH) to compete with Coinbase cryptocurrencies. The move took place after President Donald Trump signed the Genius bill, officially confirming the first cryptocurrency law in the United States.
Technical analysis angle
🟠 Main trend:
BTC is sideway accumulated in the amplitude of 117,000 - 122,000 after a sharp increase.
The chart shows the descending triangular model - a potential sign for Breakout.
🔍 important areas:
Resist:
122,000 - 122,700: Strong resistance area, fibonacci mold 1.0.
130,600 - 131,100: The expected area if Breakout is successful (Fibonacci extension 1.618).
Support:
116,000: Support close, coincide with EMA 200.
111,100: The support area is stronger if the current support breaks.
✅ Scenario 1 - Rise:
If the price turns from supporting 116k → Test the resistance area of 122k.
If the 122K break is definitive, the next goal is 130k - 131k.
❌ Scenario 2 - Discount:
If the 116k area is lost, the possibility of falling will fall more deeply at 111k.
This is also the strong EMA area Fibo 0.382 of the previous wave.
Please follow the channel to receive the latest and continuous updates on XauUSD, currency and BTC
LINK START...Hello friends🙌
📈As you can see, the upward trend has started, and the power is in the hands of buyers, and here we have an opportunity to enter a buy trade with risk and capital management to move with the specified goals.
🔥Follow us for more signals🔥
*Trade safely with us*

uptrend, heading towards 3400⭐️GOLDEN INFORMATION:
Gold prices (XAU/USD) climb toward $3,350 in early Asian trading on Tuesday, supported by renewed safe-haven demand after US President Donald Trump threatened sweeping 100% tariffs on Russia. Traders now shift focus to the upcoming US Consumer Price Index (CPI) report, which could offer further cues for the Federal Reserve’s policy outlook.
Late Monday, Trump warned that unless Russian President Vladimir Putin agrees to a peace deal to end the Ukraine conflict within 50 days, the US will impose 100% tariffs on Russian goods. The proposed sanctions, described as secondary tariffs, lack detailed clarification but have already fueled market anxiety. Heightened geopolitical tensions are likely to sustain near-term demand for gold as investors seek safety in the yellow metal
⭐️Personal comments NOVA:
Maintaining buying pressure above 3350, gold price in an uptrend, paying attention to CPI results to assess the inflation level of the world's number 1 economy
⭐️SET UP GOLD PRICE:
🔥SELL GOLD zone: 3400- 3402 SL 3407
TP1: $3390
TP2: $3380
TP3: $3370
🔥BUY GOLD zone: $3330-$3328 SL $3323
TP1: $3340
TP2: $3350
TP3: $3360
⭐️Technical analysis:
Based on technical indicators EMA 34, EMA89 and support resistance areas to set up a reasonable BUY order.
⭐️NOTE:
Note: Nova wishes traders to manage their capital well
- take the number of lots that match your capital
- Takeprofit equal to 4-6% of capital account
- Stoplose equal to 2-3% of capital account

RIOT Stock: Leveraged Bet on Bitcoin’s Next Leg UpMy Bullish Thesis:
1. Leverage to Bitcoin Without Holding BTC
RIOT is one of the largest publicly traded Bitcoin miners in the U.S., offering investors exposure to the upside of Bitcoin — without directly owning the coin.
If Bitcoin goes to $100K or higher, miner stocks like RIOT historically outperform BTC in percentage terms.
This makes RIOT a high-beta play on the ongoing crypto bull market.
2. Post-Halving Upside
The April 2024 Bitcoin halving cut block rewards by 50%, which squeezes less-efficient miners — but RIOT benefits from:
Low-cost mining operations due to cheap electricity agreements in Texas.
Recent upgrades in hardware efficiency (with high-performance ASICs).
Greater share of the network hash rate as weaker players drop out.
Historically, Bitcoin and miners perform best in the 6–18 months after a halving, positioning RIOT for strong gains through year-end 2025.
3. Massive Infrastructure and Expansion
RIOT owns a 400+ megawatt mining facility in Texas, one of the largest in North America.
They’re expanding capacity and have locked in long-term energy deals that give them a key advantage during spikes in energy costs.
The company also earns revenue through demand response credits, essentially being paid to shut down power usage during Texas grid stress — a unique hedge for a miner.
4. Regulatory Edge Over Offshore Miners
As U.S.-based and NASDAQ-listed, RIOT is better positioned than foreign or unregulated competitors if/when the U.S. passes legislation around digital assets and mining.
This could lead to greater institutional adoption of RIOT versus other miners.
It’s also eligible for ETF inclusion or institutional funds focused on digital infrastructure or U.S. innovation.
RIOT is a classic “picks and shovels” play on the Bitcoin bull run — offering levered upside without having to buy BTC directly. With post-halving tailwinds, institutional favorability, and a strong technical breakout in progress, RIOT may be one of the top speculative growth plays in the crypto equity space heading into the second half of 2025.
Disclosure: I am part of Trade Nation's Influencer program and receive a monthly fee for using their TradingView charts in my analysis.

WULF TeraWulf Leader in Clean Crypto Mining & HPC InfrastructureIf you haven`t bought WULF before the rally:
Now TeraWulf WULF is emerging as a compelling growth story in the digital infrastructure and cryptocurrency mining sectors, distinguished by its commitment to zero-carbon energy and expanding high-performance computing (HPC) hosting capabilities. Despite near-term financial challenges, the company’s rapid capacity growth, strong cash position, and strategic initiatives position it well for substantial upside in 2025 and beyond.
1. Rapid Expansion of Mining Capacity and Hashrate Growth
TeraWulf energized Miner Building 5, increasing its total mining capacity to 245 MW and boosting its Bitcoin mining hashrate to 12.2 exahashes per second (EH/s), a 52.5% increase year-over-year.
This significant growth in self-mining capacity enhances revenue potential and operational scale, positioning TeraWulf among the more efficient and sizable clean-energy miners.
The company’s vertically integrated model, powered primarily by zero-carbon energy, aligns with increasing regulatory and investor demand for sustainable crypto mining.
2. Strategic Buildout of High-Performance Computing (HPC) Infrastructure
TeraWulf commenced the buildout of dedicated HPC data halls and remains on track to deliver 72.5 MW of gross HPC hosting infrastructure to Core42 in 2025.
The company is actively pursuing additional HPC customers, targeting 200–250 MW of operational HPC capacity by the end of 2026, which diversifies revenue streams beyond crypto mining.
HPC infrastructure is a high-growth segment driven by demand for AI, big data, and cloud computing, offering TeraWulf exposure to secular technology trends.
3. Strong Financial Position and Capital Allocation
As of March 31, 2025, TeraWulf held approximately $219.6 million in cash and bitcoin holdings, providing liquidity to fund expansion and weather market volatility.
The company has repurchased $33 million of common stock in 2025, signaling management’s confidence in the business and commitment to shareholder value.
While total outstanding debt is around $500 million, TeraWulf maintains a strong current ratio (~5.4), indicating solid short-term liquidity.
4. Industry-Leading Sustainability Profile
TeraWulf’s focus on zero-carbon energy for its mining operations differentiates it in an industry increasingly scrutinized for environmental impact.
This green positioning not only appeals to ESG-conscious investors but may also provide access to incentives, partnerships, and preferential contracts as governments and enterprises emphasize sustainability.
5. Revenue Growth Outlook and Market Opportunity
Despite a temporary revenue dip to $34.4 million in Q1 2025, the company is projected to deliver a 53% increase in revenue for the full year 2025, significantly outpacing industry averages.
The combination of expanding mining capacity and HPC hosting services positions TeraWulf to capitalize on the growing demand for digital infrastructure powered by clean energy.
6. Navigating Financial Challenges with Growth Focus
TeraWulf reported a GAAP net loss of $0.16 per share in Q1 2025, reflecting ongoing investments in capacity and infrastructure.
Operational cash flow remains positive and improving, with management focused on scaling efficiently and improving margins over time.

xauusd weekly analysis
**XAU/USD Weekly Analysis**
*(June 2-13, 2025)*
---
### **LAST WEEK'S PERFORMANCE (June 2-6)**
**Price Action:**
- Weekly decline: **~2%**
- Key levels:
- Resistance: $3,355–$3,381 (61.8% Fibo)
- Support: $3,272–$3,288 (38.2% Fibo)
- Range: $3,291.50 (low) to $3,365 (high)
- Close: Near $3,310–$3,316
**Key Drivers:**
1. **USD Strength**: Fiscal concerns (Senate tax bill debate adding $3.8T debt)
2. **Reduced Safe-Haven Demand**: Trump delayed EU tariffs to July 9
3. **Central Bank Caution**: Market awaited ECB/BoC decisions and U.S. jobs data
---
### **NEXT WEEK OUTLOOK (June 9-13)**
**Critical Technical Levels:**
| **Support** | **Resistance** |
|-------------------|-------------------|
| $3,272–$3,288 | $3,370–$3,375 |
| $3,295 (SMA) | $3,381 (Key Breakout) |
| $3,210–$3,214 | $3,400–$3,434 |
**Fundamental Catalysts:**
1. **Central Banks**:
- ECB Decision (June 12) → Dovish stance = USD strength
- BoC Decision (June 11) → Rate cuts may boost USD
2. **U.S. Data**:
- Non-Farm Payrolls (June 13) → Strong data = fewer Fed rate cuts
3. **Geopolitical Risks**:
- Escalations in Ukraine/Middle East → Safe-haven demand
4. **U.S. Fiscal Policy**: Senate vote on $3.8T tax bill
**Market Sentiment:**
- **Bullish Case**: Break above $3,381 targets $3,500–$3,800
- **Bearish Risks**: Breakdown below $3,272 risks drop to $3,160
---
### **TRADING STRATEGY**
**Key Approaches:**
- **🔺 Long Setup**:
- Entry: Above $3,381
- Target: $3,500
- Stop-loss: $3,320
- **🔻 Short Setup**:
- Entry: Below $3,272
- Target: $3,210
- Stop-loss: $3,310
- **Event Hedging**: Use options around ECB/BoC/NFP events
**Risk Management Note:**
> "Gold's trajectory hinges on USD dynamics and central bank guidance. A weekly close above $3,381 confirms bull trend resumption."
---
### **KEY EVENTS CALENDAR**
| Date | Event | Impact Level |
|------------|---------------------------|--------------|
| June 11 | Bank of Canada Rate Decision | High |
| June 12 | ECB Rate Decision | High |
| June 13 | US Non-Farm Payrolls | Very High |
| Mid-week | US Senate Tax Bill Vote | Moderate-High|
---
**Conclusion:**
Next week presents a binary setup for XAU/USD:
- Break above **$3,381** opens path to $3,500+
- Failure to hold **$3,272** risks correction to $3,210
Prioritize risk management during high-impact events. The long-term uptrend remains intact but short-term direction depends on USD and central bank policy.
for intra day traders and scalpers follow the range zone

Can the bulls help gold hit 3400 today?⭐️GOLDEN INFORMATION:
Gold prices surged more than 0.80% on Wednesday during the North American session, buoyed by disappointing U.S. economic data that signaled a slowdown in business activity and softer job growth. XAU/USD climbed to $3,382 after rebounding from a session low of $3,343.
Heightened tensions between the U.S. and China also contributed to bullish momentum in bullion. With uncertainty looming over upcoming trade negotiations between Washington and Beijing, investors sought refuge in safe-haven assets like gold.
Adding to market jitters, President Donald Trump signed an executive order doubling tariffs on steel and aluminum imports—from 25% to 50%—effective June 4. The move came just days ahead of a highly anticipated call between Trump and Chinese President Xi Jinping, further fueling concerns over escalating trade frictions.
⭐️Personal comments NOVA:
Buying power is continuing, will break out strongly in the US trading session
⭐️SET UP GOLD PRICE:
🔥SELL GOLD zone : 3435- 3437 SL 3442
TP1: $3420
TP2: $3410
TP3: $3400
🔥BUY GOLD zone: $3344- $3346 SL $3339
TP1: $3355
TP2: $3368
TP3: $3382
⭐️Technical analysis:
Based on technical indicators EMA 34, EMA89 and support resistance areas to set up a reasonable BUY order.
⭐️NOTE:
Note: Nova wishes traders to manage their capital well
- take the number of lots that match your capital
- Takeprofit equal to 4-6% of capital account
- Stoplose equal to 2-3% of capital account

PL Planet Labs PBC Options Ahead of EarningsAnalyzing the options chain and the chart patterns of PL Planet Labs PBC prior to the earnings report this week,
I would consider purchasing the 4usd strike price Calls with
an expiration date of 2025-6-20,
for a premium of approximately $0.37.
If these options prove to be profitable prior to the earnings release, I would sell at least half of them.

Bitcoin Wasn't Built for Bull Runs — It Was Built for This MomenDear traders,
You may be witnessing a “first” — a pivotal moment right before things begin to spiral.
We’re not fortune tellers. We don’t claim to predict the future.
But what you’re about to read is based entirely on **publicly available data**, interpreted not through speculation, but through a deep, rational analysis of interconnected facts — the kind of connections that most overlook, and few dare to question.
We may not know how the future is being orchestrated behind the scenes...
But one thing seems certain: **crisis always comes first...** and *then* we are given a **narrative** to justify it — be it war, a pandemic, or a "global emergency."
This is the correct sequence... and it’s the one they never teach you.
Yet for those of us who navigate the financial markets, one question matters more than all others:
**How do we profit from this?**
---
We recently shared an important setup on the **Nasdaq index**, the benchmark that reflects — to a large extent — the true state of the U.S. economy.
As a proxy for the 100 largest American corporations, the Nasdaq plays a critical role in signaling macro trends.
And while some are just now waking up to the storm ahead, **our outlook has been clear since October 2022**:
A major economic crisis was not only probable… it was **inevitable**.
Some analysts chalk this up to uncontrolled money printing post-2019 as governments tried to patch the damage from the COVID-19 crisis. That’s one explanation.
But at **Glich**, our vision is different.
More complex.
And for now… **not something we can fully release**.
---
For years, strong correlations between **risk markets** — especially U.S. equities and crypto — held firmly in place.
But something changed on **May 30th, 2025**. Completely and unmistakably.
The link was severed.
Now ask yourself:
**Why was Bitcoin created in the first place?**
It wasn’t just digital money.
It was a bold, revolutionary idea. A system designed for a future economy no longer shackled by inflation, central banking failures, or hidden agendas.
A fluid, transparent, and secure network for a world in desperate need of change.
The current financial model is obsolete. It’s no longer evolving — just surviving.
And it can no longer answer the challenges of what's to come.
**2008 was not the collapse; it was the setup.** A convenient pretext to slowly roll out something **new**.
And "Satoshi Nakamoto"? Well, let’s just say...
**That name means more than you think.**
_"HIDDEN INFORMATION"_ 👁️
---
What does NEO mean when he says:
> "This has all happened before… yet it’s happening for the first time"?
And what does that have to do with us?
This analysis is *not* just about charts or setups.
It’s a **hidden message** — a spotlight on a once-in-a-generation opportunity lying in plain sight.
But not everyone is trained to read between the lines.
---
Let us ask:
- Why was **Donald Trump** specifically pushed into position?
- Why is crypto — after being suppressed, banned and attacked worldwide — now being quietly **promoted** and fast-tracked in legislation during 2024 and 2025?
Something’s moving beneath the surface.
---
### 🔍 In summary:
- Expect a tidal wave of **global crypto legislation** to pass in the coming **days/weeks/months**.
- Crypto — particularly **BTC and ETH** — will become silent **stores of value** during the economic storm.
- Expect record-breaking levels: **$400K for Bitcoin**, **$40K for Ethereum**.
Yes, this may sound like science fiction…
But keep your eyes and ears wide open. 👁️
- And brace yourself for a **historic collapse** in U.S. equities. Possibly… something we’ve never seen before.
---
The show is starting.
And we won’t spoil the ending — because watching it unfold is part of the experience.
But here’s what we *can* say, thanks to our proprietary **algorithmic system**:
- The **U.S. economy will bleed**.
- And crypto will blow past expectations — fulfilling the very purpose it was built for.
---
🛒 Load your bags in the coming days...
Because when this train leaves the station —
It won't be stopping for anyone.

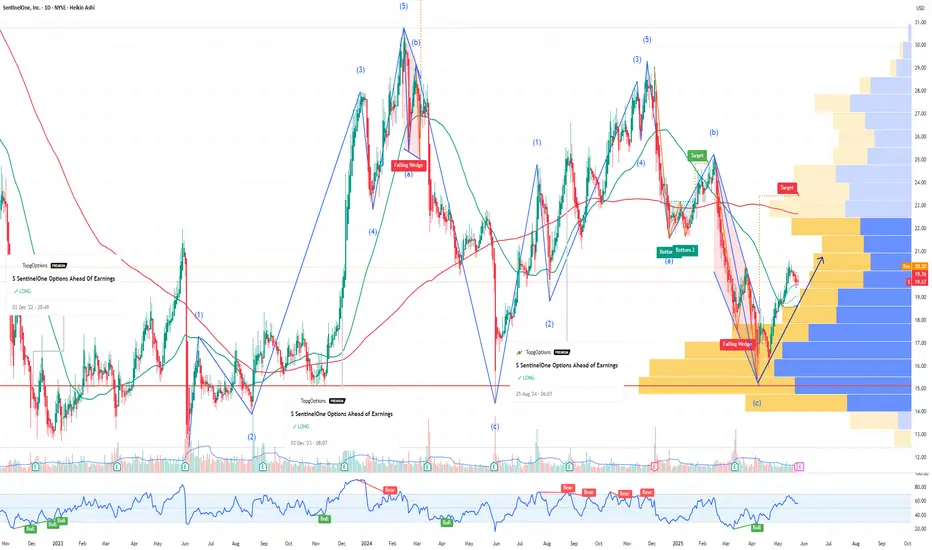
S SentinelOne Options Ahead of EarningsIf you haven`t bought S before the recent rally:
Now analyzing the options chain and the chart patterns of S SentinelOne prior to the earnings report this week,
I would consider purchasing the 20usd strike price Calls with
an expiration date of 2025-9-19,
for a premium of approximately $2.50.
If these options prove to be profitable prior to the earnings release, I would sell at least half of them.
Bitcoin Forecast: May 2025 OutlookMay 2025 has marked a strong upward trend for Bitcoin, with the leading cryptocurrency steadily trading in the $100,000–$105,000 range and hitting multi-month highs. This growth has been largely fueled by active accumulation from institutional investors, including exchange-traded funds (ETFs), reinforcing Bitcoin’s growing integration into the traditional financial system.
Institutional Demand as a Key Driver
A major factor behind Bitcoin’s recent surge is the increasing flow of capital from institutional investors. Large ETFs, such as those managed by BlackRock and Fidelity, have expanded their positions in BTC, sending a strong signal of confidence from established financial institutions. This has further boosted interest from retail investors and strengthened the overall bullish momentum.
Macroeconomic Context
Another significant influence is the market's anticipation of a potential interest rate cut by the U.S. Federal Reserve. A more dovish monetary policy stance would make riskier assets, including cryptocurrencies, more attractive, encouraging further investment in Bitcoin.
While the Fed is expected to make a rate decision in June, markets tend to price in such moves early, which is already being reflected in Bitcoin’s price trajectory.
Forecast: How Much Could Bitcoin Be Worth by End of May?
Given the current momentum and positive market sentiment, analysts suggest that Bitcoin could continue its ascent. Optimistic forecasts predict that BTC might reach $120,000–$130,000 by the end of the month, provided macroeconomic conditions remain favorable. Still, the inherent volatility of the crypto market means potential pullbacks should not be ruled out.
Conclusion
May 2025 could prove to be a pivotal month for Bitcoin. Increased institutional participation, supportive macroeconomic signals, and favorable technical indicators are all contributing to its ongoing rally. If the current trend continues, Bitcoin could set new all-time highs in the coming weeks.

KODK Eastman Kodak Company Options Ahead of EarningsIf you haven`t bought KODK before the previous earnings:
Now analyzing the options chain and the chart patterns of KODK Eastman Kodak prior to the earnings report this week,
I would consider purchasing the 7.5usd strike price Calls with
an expiration date of 2026-1-16,
for a premium of approximately $0.92.
If these options prove to be profitable prior to the earnings release, I would sell at least half of them.

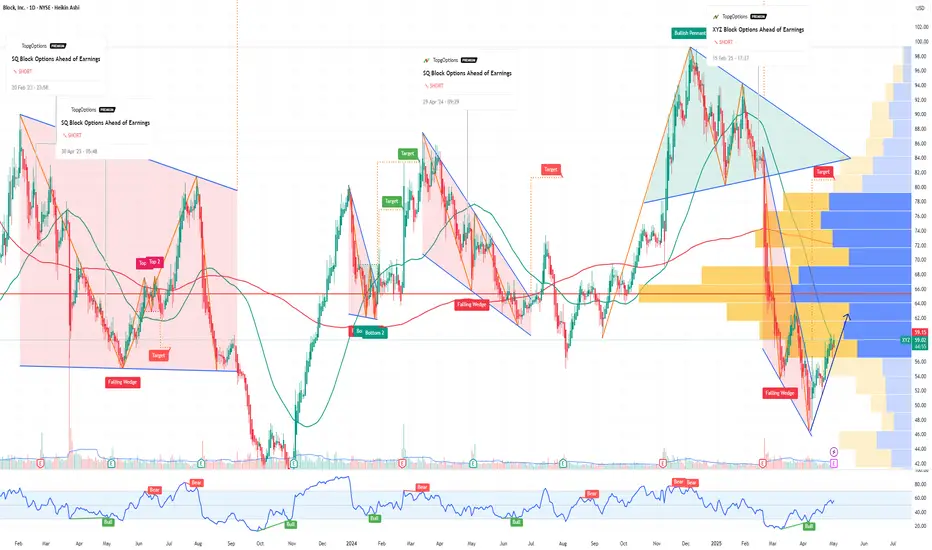
XYZ Block Options Ahead of EarningsIf you haven`t sold XYZ before the previous earnings:
Now analyzing the options chain and the chart patterns of XYZ Block prior to the earnings report this week,
I would consider purchasing the 58usd strike price Calls with
an expiration date of 2025-5-2,
for a premium of approximately $3.40.
If these options prove to be profitable prior to the earnings release, I would sell at least half of them.
Bullish Pennant Confirms Breakout: Momentum Builds Toward 1.19The pair has formed a textbook bullish pennant on the 4-hour timeframe following a sharp impulsive move upward. Price action consolidated within a narrowing triangle, signaling accumulation before the next leg higher.
The breakout above the pennant’s resistance suggests continuation of the uptrend, with projected Fibonacci targets at:
1.1781 (1.272 extension)
1.1940 (1.414 extension)
Volume behavior confirms the pattern: declining during the consolidation phase and increasing at the breakout, supporting a strong bullish bias.
Fundamental backdrop:
-The US Dollar faces pressure as markets increasingly price in a potential Fed rate cut in the second half of 2025.
-The ECB maintains a more hawkish stance, reinforcing euro strength relative to USD.
-Eurozone economic data shows signs of inflation stabilization, while US CPI readings remain mixed.
-Capital rotation favors major currencies with resilient monetary policies and macroeconomic stability.
As long as EUR/USD holds above 1.1476, the bullish scenario remains intact. A move toward 1.1781 and 1.1940 appears likely. A breakdown below 1.1237 would invalidate the pennant and shift momentum toward support retests.

Are we there yet? My bags are fully packed. LFG!I have been waiting to long for this to break out.
it feels like this is about to finally send over the next 8 months or so. Last chance to load up for this potential 10X
My buy and sell zones are clearly marked. but what I have painfully learned is that price is less important than time. I don't care what the price is at the end of the year, whether that be way under my targets or not.
-buy now
-sell >75% in December.
simple.

Gold update 4H 28.03.2025Technical Overview
Gold has broken out of a bullish pennant, confirming the continuation of the uptrend. XAU/USD is currently testing resistance around $3,087. A successful breakout could push prices toward $3,108–$3,138 (0.618 and 0.786 Fibonacci levels).
Key Levels:
Support: $3,066 | $3,040
Resistance: $3,087 | $3,108 | $3,138
Indicators:
The oscillator shows overbought conditions, suggesting a possible short-term pullback.
A retest of $3,066 could provide a support zone for continuation.
Fundamental Factors
Fed interest rate decisions and inflation data will impact gold.
Market uncertainty continues to drive demand for gold as a safe-haven asset.
Potential Scenarios
Bullish: A strong breakout above $3,087 could lead to a rally toward $3,108 and $3,138.
Bearish: Failure to hold above $3,087 may trigger a pullback toward $3,066 and $3,040.
A breakout above $3,087 could open the path toward $3,108–$3,138.

BTC Bitcoin Price Target by Year EndSeveral factors support a bullish outlook for Bitcoin (BTC) to reach $97,500 by the end of the year:
Institutional Adoption and Treasury Investments: Companies like GameStop are incorporating Bitcoin into their treasury reserves, following the lead of firms such as MicroStrategy. GameStop plans to raise $1.3 billion for Bitcoin purchases, indicating growing corporate confidence in BTC as a store of value.
Supportive Regulatory Environment: The U.S. administration has pledged to make the country the "undisputed Bitcoin superpower and crypto capital of the world." Plans include introducing clear regulations for stablecoins and market structures, aiming to stimulate investment and innovation in the crypto sector.
Positive Price Forecasts: Analysts have set bullish targets for Bitcoin, with some predicting prices ranging from $120,000 to $150,000 by year-end. These projections are based on factors like supply shocks and increased institutional adoption.
Seasonal Trends and Market Liquidity: Historically, the second quarter has been favorable for Bitcoin, with increased market liquidity and investor interest. Currently, approximately $31.8 billion in "dry powder" is poised to enter the crypto markets, potentially driving prices higher.
Finite Supply and Growing Demand: Bitcoin's capped supply of 21 million coins, coupled with rising global demand, supports its long-term value appreciation. Its growing acceptance and technological advancements, despite evolving regulatory landscapes, bolster its investment appeal.
These factors collectively suggest a favorable environment for Bitcoin to approach or surpass the $97,500 mark by year-end.

FFAI Faraday Future Options Ahead of EarningsAnalyzing the options chain and the chart patterns of FFAI Faraday Future Intelligent Electric prior to the earnings report this week,
I would consider purchasing the 1.50usd strike price Puts with
an expiration date of 2025-4-17,
for a premium of approximately $0.20.
If these options prove to be profitable prior to the earnings release, I would sell at least half of them.

Tesla Update 3 Whats Next after Target Long Hit Quick recap of the previous level I gave for tesla which is now + 35% off of that level . In this video I use fibs and channels + gann box .
Show your support for continued analysis with a boost and feel free to ask any questions

DOTUSDT BUY SIGNAL|Volume Profile Strategy With QM StrategyDOTUSDT BUY SIGNAL
Volume Profile Strategy With QM Strategy
buy 4.7 USDT zone
target 1 : 6.4 USDT net price 36% profit
target 2 :7.6 USDT net price 62% profit
target 3 : 9.0 USDT net price 90% profit (long time)
Enjoy
:)

this is a golden time to buy FILUSDT(136% Profit)Golden Signal :
Buy in this zone about 3.200
Sell Zone For Step 1 and Take Your profit 50% Is First Red Box ,4.333 USDT (34% Profit)
Sell Zone For Step 1 and Take Your profit 50% Is Secound Red Box, 7.578 USDT(136% Profit)
Enjoy
:)

Chartsssss"What impact do you think Bitcoin has on other coins? Why should Solana’s chart resemble Bitcoin's? Is our trend downward, heading for lower supports? God knows? My heart hurts, I see Bitcoin like this."
