Can gold price maintain the uptrend above 3400?⭐️GOLDEN INFORMATION:
Gold prices advanced by approximately 0.97% on Wednesday, buoyed by signs of easing inflation in the United States (US), which reinforced expectations that the Federal Reserve (Fed) could resume rate cuts as early as September. At the time of writing, XAU/USD is trading around $3,363.
The May Consumer Price Index (CPI) report shows a slowdown in price pressures compared to April, prompting a surge in demand for the yellow metal. In response, gold briefly rallied to an intraday high near $3,360 before paring back some of those gains, as investors recalibrated their outlook on the Fed’s policy path.
⭐️Personal comments NOVA:
Middle East concerns, along with information about influential high tariffs on countries without trade agreements. Gold prices have recovered, but there is no long-term stability.
⭐️SET UP GOLD PRICE:
🔥SELL GOLD zone: 3428- 3430 SL 3435
TP1: $3410
TP2: $3395
TP3: $3382
🔥BUY GOLD zone: $3345-$3343 SL $3338
TP1: $3355
TP2: $3367
TP3: $3380
⭐️Technical analysis:
Based on technical indicators EMA 34, EMA89 and support resistance areas to set up a reasonable BUY order.
⭐️NOTE:
Note: Nova wishes traders to manage their capital well
- take the number of lots that match your capital
- Takeprofit equal to 4-6% of capital account
- Stoplose equal to 2-3% of capital account
Buysellsignal

Pending Gap On Weekly Timefram, Buy Or Sell ? #defense #bdlIn this chart bdl is is going to fill the gap it made on weekly timeframe to collect more liquidity to bounce back up side. what should you do, buy or sell ? #bdl #defensestock #cochinship

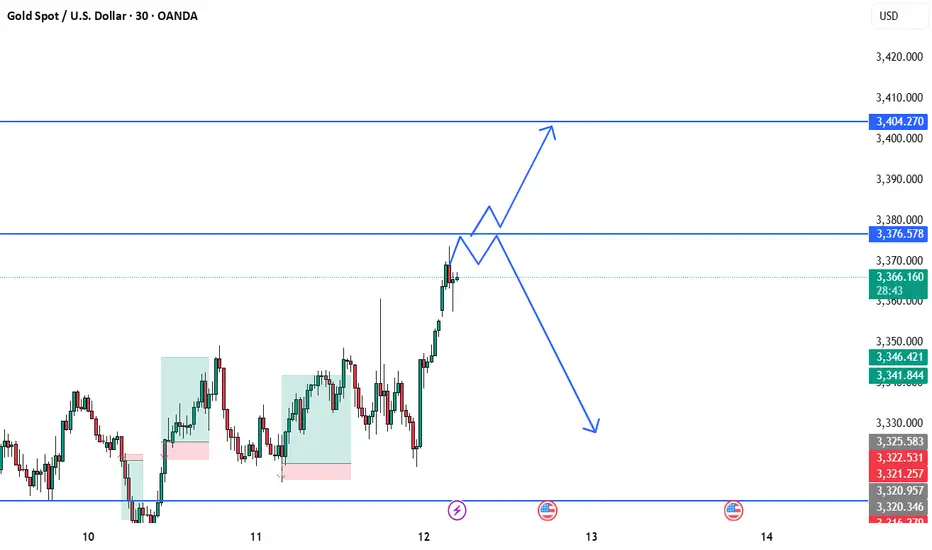
BEST XAUUSD M30 BUY AND SELL SETUP FOR TODAY Gold has shown a strong bullish push, breaking above recent consolidation and approaching a key resistance zone around $3,376. ⚔️ This area will be decisive — if price holds above it and confirms support, we could see a further rally toward $3,404. 📈✨ However, failure to sustain above this level could trigger a bearish rejection, pulling the market back toward the $3,330–$3,340 range. 📉🔄 Traders should wait for clear price action confirmation before entering. React, don’t predict! 🎯🧠
BEST XAUUSD M30 BUY SETUP FOR TODAYPrice is showing signs of bullish strength after reclaiming key demand zones near 3,310.926–3,315.098 🟦. The recent CHoCH (Change of Character) and strong bullish reaction from the demand block suggests a potential move toward the 3,360 resistance area 🔼. Buyers are likely stepping in with momentum, aiming for a break above previous highs 📉➡️📈. As long as price stays above the 3,315 support, the bullish scenario remains valid — watch for continuation toward higher highs. 🚀💹

BEST XAUUSD BUY AND SELL SETUP FOR TODAY 📉📊 Gold (XAU/USD) Analysis – Key Levels in Focus! 📈🧐
Gold is currently trading around the 3,326 zone after a recent pullback. Price is approaching the key support level at 3,310, where a potential bullish bounce may occur, targeting the next resistance near 3,350. 🛑 However, if price fails to hold above 3,310, we may see further downside movement towards the 3,293 support. 📉 Traders should watch for reaction and confirmation around these zones before taking entries. ⚠️💡 A bullish reversal could trigger strong buying momentum, while a bearish break may lead to deeper correction. 🎯💰

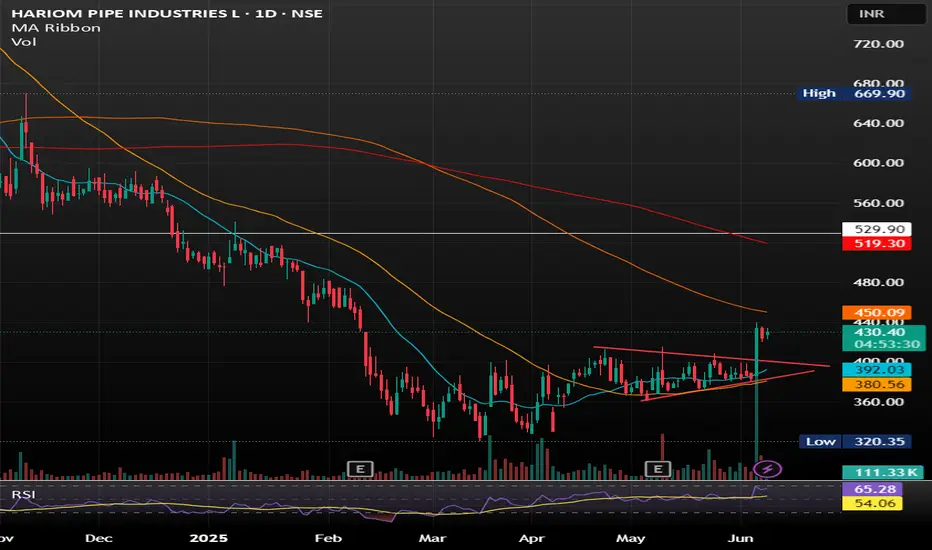
Hariom Pipes Industries Ltd Hariom Pipes Industries Ltd is a leading manufacturer of high-quality steel products, including HR Pipes, GI Pipes, GP Pipes, MS Pipes, HR Coils, and Billets. The company was established in 2007 and has grown into a major player in the iron and steel industry in India.
SYMETRIC TRIANGLE BREAKOUT WITH GOOD VOLUME SHOWING GOOD UPWARD MOMENTUM .
BUY IN ANY PULLBACK SUGGESTS.
Can the bulls help gold hit 3400 today?⭐️GOLDEN INFORMATION:
Gold prices surged more than 0.80% on Wednesday during the North American session, buoyed by disappointing U.S. economic data that signaled a slowdown in business activity and softer job growth. XAU/USD climbed to $3,382 after rebounding from a session low of $3,343.
Heightened tensions between the U.S. and China also contributed to bullish momentum in bullion. With uncertainty looming over upcoming trade negotiations between Washington and Beijing, investors sought refuge in safe-haven assets like gold.
Adding to market jitters, President Donald Trump signed an executive order doubling tariffs on steel and aluminum imports—from 25% to 50%—effective June 4. The move came just days ahead of a highly anticipated call between Trump and Chinese President Xi Jinping, further fueling concerns over escalating trade frictions.
⭐️Personal comments NOVA:
Buying power is continuing, will break out strongly in the US trading session
⭐️SET UP GOLD PRICE:
🔥SELL GOLD zone : 3435- 3437 SL 3442
TP1: $3420
TP2: $3410
TP3: $3400
🔥BUY GOLD zone: $3344- $3346 SL $3339
TP1: $3355
TP2: $3368
TP3: $3382
⭐️Technical analysis:
Based on technical indicators EMA 34, EMA89 and support resistance areas to set up a reasonable BUY order.
⭐️NOTE:
Note: Nova wishes traders to manage their capital well
- take the number of lots that match your capital
- Takeprofit equal to 4-6% of capital account
- Stoplose equal to 2-3% of capital account

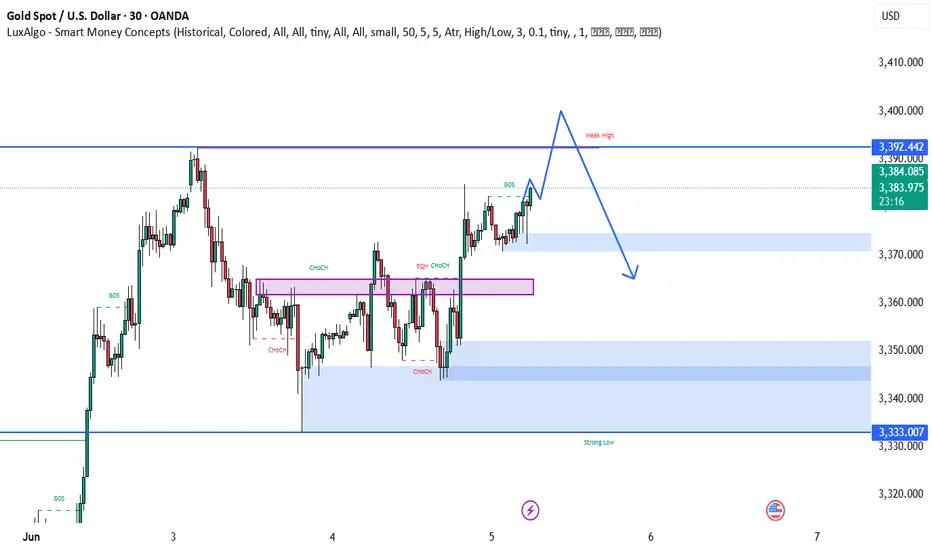
BEST XAUUSD M30 BUY AND SELL SUTUP FOR TODAY📊 Gold is currently showing bullish strength with a break above key structure levels and multiple CHoCH confirmations. Price is approaching a weak high near 3,392, which may act as a liquidity target before potential reversal. 🔄 After sweeping this high, a bearish move could unfold, aiming for the demand zones between 3,350–3,333 where buyers may step back in. 🧠 Traders should prepare for a liquidity grab scenario, with bullish continuation likely invalidated if price closes below the strong demand. ⚠️ Watch price action closely near the weak high and key imbalance zones. 🚀🔁📉
FCEL FuelCell Energy Options Ahead of EarningsAnalyzing the options chain and the chart patterns of FCEL FuelCell Energy prior to the earnings report this week,
I would consider purchasing the 5usd strike price Calls with
an expiration date of 2025-7-3,
for a premium of approximately $1.10.
If these options prove to be profitable prior to the earnings release, I would sell at least half of them.

FIVE Five Below Options Ahead of EarningsIf you haven`t bought FIVE before the previous earnings:
Now analyzing the options chain and the chart patterns of FIVE Five Below prior to the earnings report this week,
I would consider purchasing the 115usd strike price Puts with
an expiration date of 2025-6-20,
for a premium of approximately $4.35.
If these options prove to be profitable prior to the earnings release, I would sell at least half of them.

BEST XAUUSD M30 SELL SETUPNFOR TODAY 📉 Gold Analysis Summary – Bearish Setup Alert ⚠️
Gold is currently showing signs of weakness after a strong bullish push. A Change of Character (CHOCH) has confirmed a potential shift in trend. Price is approaching a supply zone (highlighted in purple), and rejection from this level could trigger a downward move. 🔄 The projected path suggests a potential lower high formation, followed by a drop towards the 3,348 and 3,331 key demand levels. 🧠 Watch for bearish confirmation near resistance before entering short positions. 📊💥

Crude oil futures Trade the range In this video I look at the current range that we are in and I have laid out a plan in the scenario that we break that range to the upside and what we could possibly expect .
I have given some reaction zones where I anticipate price to react when we reach there .
I have used Fibonacci, volume profile, and vwap in this video .
Thankyou for your support

BTC Scalping / Intraday Signal – Entry, Stop & Target Ready!🕒 Timeframe: 15min / 5min
⚠️ Note: Manage your risk — intraday volatility is high.
This is a short-term opportunity, not a long hold.
Disclaimer: This is our personal analysis and not financial advice. Always do your own research before making any investment decisions.
💬 What’s your take on this? Drop your thoughts in the comments and feel free to share this with your friends! ❤️

ETH Scalping Signal – Entry, Stop & Target Ready!🕒 Timeframe: 15min / 5min
⚠️ Note: Manage your risk — intraday volatility is high.
This is a short-term opportunity, not a long hold.
Disclaimer: This is our personal analysis and not financial advice. Always do your own research before making any investment decisions.
💬 What’s your take on this? Drop your thoughts in the comments and feel free to share this with your friends! ❤️

BEST XAUUSD M30 BUY SETUP FOR TODAY 📈 Gold (XAU/USD) is showing bullish momentum on the 30-min chart, trading within a rising parallel channel. Price has recently bounced from lower support and is aiming for the resistance zone near $3,331. 🔼 A breakout above this level could signal further upside, continuing the bullish wave structure. Traders should watch for pullbacks to the lower trendline as potential buying opportunities. 🧠💡 As long as price stays above the $3,251 support, the bullish bias remains intact. 📊✨

Gold price recovers above 3300, tariff impact⭐️GOLDEN INFORMATION:
Gold prices (XAU/USD) edged higher to around $3,310 during early Asian trading on Monday, buoyed by renewed demand for safe-haven assets amid lingering tariff uncertainty and heightened geopolitical risks.
Investors remain cautious following fresh tensions between the United States and China, after President Donald Trump accused Beijing of breaching the terms of their trade agreement. This has rattled global markets and lent support to the precious metal. Market participants now turn their attention to the upcoming US ISM Manufacturing PMI report for May, scheduled for release later in the day, which could offer further direction for gold.
⭐️Personal comments NOVA:
US raises tariffs on EU steel, a reminder of quickly negotiated deals, gold prices positive above 3300
⭐️SET UP GOLD PRICE:
🔥SELL GOLD zone : 3335- 3337 SL 3342
TP1: $3328
TP2: $3315
TP3: $3300
🔥BUY GOLD zone: $3289- $3287 SL $3282
TP1: $3297
TP2: $3308
TP3: $3318
⭐️Technical analysis:
Based on technical indicators EMA 34, EMA89 and support resistance areas to set up a reasonable BUY order.
⭐️NOTE:
Note: Nova wishes traders to manage their capital well
- take the number of lots that match your capital
- Takeprofit equal to 4-6% of capital account
- Stoplose equal to 2-3% of capital account

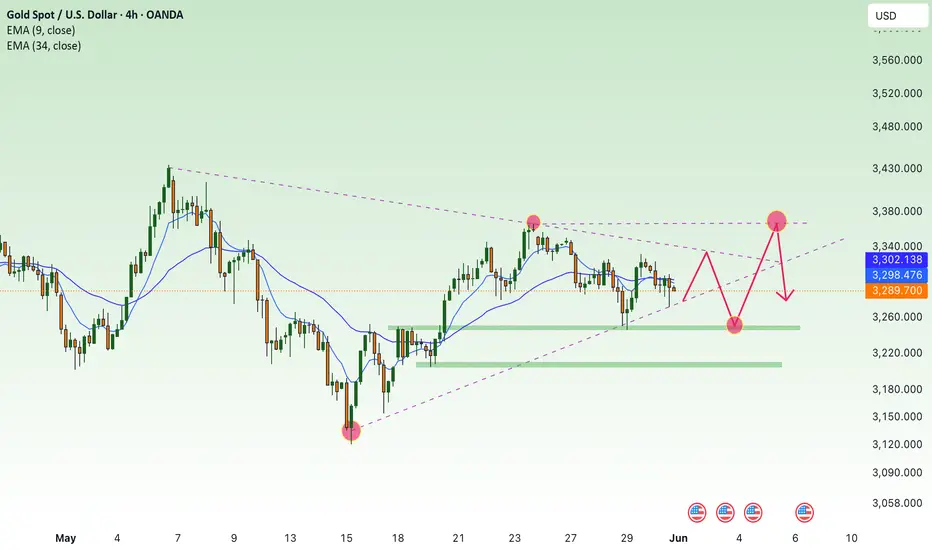
Continue to maintain stability above 3300, next week✍️ NOVA hello everyone, Let's comment on gold price next week from 06/02/2025 - 06/06/2025
🔥 World situation:
Gold prices declined on Friday, pressured by a rebound in the US Dollar, even as US Treasury yields dipped in response to a robust inflation report. Despite the yield pullback, expectations remain firm that the Federal Reserve could begin easing policy in 2025. At the time of writing, XAU/USD is down 0.83%, trading around $3,289.
Market sentiment turned more risk-averse after US President Donald Trump sharply criticized China, accusing Beijing of breaching the trade agreement reached during talks in Switzerland. In a post, Trump wrote, “China, perhaps not surprisingly to some, HAS TOTALLY VIOLATED ITS AGREEMENT WITH US. So much for being Mr. NICE GUY!”—a statement that reignited geopolitical tensions and added to market uncertainty.
🔥 Identify:
Gold price is in great competition between buyers and sellers around the price range of 3200 - 3300. Tariff policies are coming back, the trump administration is putting pressure to get favorable tariffs.
🔥 Technically:
Based on the resistance and support areas of the gold price according to the H4 frame, NOVA identifies the important key areas as follows:
Resistance: $3332, $3365
Support: $3244, $3204
🔥 NOTE:
Note: Nova wishes traders to manage their capital well
- take the number of lots that match your capital
- Takeprofit equal to 4-6% of capital account
- Stoplose equal to 2-3% of capital account
- The winner is the one who sticks with the market the longest
BTCUSDT.P | Multi Timeframe AnalyseHello to my dear friends.
Everything is told in the video.
Enjoy the trading fam.

BTCUSD HTF cycle analysis
Hi, I’m from Phoenix FX, and today I’ll be sharing my perspective on Bitcoin (BTC) price action based on the higher timeframes.
I’ll also give you my outlook on potential trade setups for today and tomorrow. Please remember that this is not financial advice—use this information as a guide only. If you find it helpful, don’t forget to like and share it with your like-minded communities.
Higher Timeframe Analysis
In my view, BTC tends to follow clear bullish and bearish cycle zones. Typically, we see a pump to new all-time highs (ATH), followed by the formation of resistance and a retracement down to a key support level. Our trading approach focuses on identifying those critical support and resistance levels, with some interim trades based on shorter-term analysis—occasionally even counter-trend, depending on the day’s market bias.
Over the past eight years, BTC has respected a major trend resistance line. The most recent ATH, around $112K, reconfirmed the relevance of this trendline. This makes it a valuable tool for projecting future ATH levels.
Looking ahead, I expect a move towards the $115K level in the coming weeks. This would likely act as a point of resistance, at which stage we might see a reversal and a drop back down to a key support zone.
Trade Setup
The chart I'm referencing highlights what I would consider the first premium buy zone, identified using a 4-hour Fair Value Gap (FVG).
The 50% level of this zone sits at $99,450. If this zone fails to hold, we may drop further to the secondary premium buy zone, which aligns with our higher timeframe (HTF) trend support and a weekly FVG. The 50% level of this deeper zone is around $89,150.
A potential long entry at $92,550, with a stop loss around $88,000, offers an excellent risk-to-reward (RR) ratio, targeting a move up to the $115K level.
Intraday Outlook
For today, I see bearish price action, with potential rejection around the $104,300–$105,000 range. Go short around the $104,750 to $105,000 zone
This could lead to a move down toward the lower key zones highlighted in the HTF analysis.
I recommend taking partial profits (TP) at every $1,000 increment and setting your stop loss to breakeven (BE) after hitting the first target.
Final Thoughts
Price action analysis is always subjective, so I’d love to hear your thoughts and ideas in the comments—each one, teach one.
Thanks for giving me some of your time.
From the Phoenix FX team, have a great weekend!

NEAR to $45? The Signs Are All There…Just imagine traveling through time.
Many people look back with regret, wishing they had invested in cryptocurrencies before previous bullish cycles. We've all heard phrases like "If only I had bought Bitcoin at $100, I'd be a millionaire by now."
But the real question is: Will you have the courage to make the right decision when the moment comes?
You might think I'm crazy for presenting these targets today — and that's okay. But trust me, in a few months, you'll witness the phenomenal power of our analysis system. The market is fractal by nature; what happens on lower timeframes inevitably plays out on higher ones.
NEAR is one of the most promising blockchains, and all signals are aligning for a move toward $45.
The question is: Do you have the courage to take action now?

Winter Is Coming — And LINK Is Leading the Charge (x25) Chainlink acts as a bridge between blockchain and the real world.
This asset has been on our radar for years, silently building strength. Its fundamentals are rock-solid, and the current price action is highly favorable for a strategic buy.
📈 On November 12, 2023, LINK officially confirmed its journey to $400 by breaking through our algorithmic confirmation zone. Since then, it’s shown a modest price increase… and right now, it's retesting one of the best buy zones we've seen.
But here's the catch:
In the coming weeks, we expect explosive rallies — the kind that won’t allow for optimal entries anymore.
✅ We are currently positioned long on LINK, and it’s proving to be one of our strongest investments to date.
And remember:
The assets we publish on TradingView have already confirmed their trajectory toward our predicted targets.
🎬Not even Trump... not even a world war could stop what’s coming.
🚀 Buckle up... because winter is coming.
And LINK is ready to lead the storm.
🔍 Disclaimer: This is our personal analysis and not financial advice. Always do your own research before making any investment decisions.
💬 What’s your take on this? Drop your thoughts in the comments and feel free to share this with your friends! ❤️

SOL/USDT"Solana, like the other two coins, is also poised for growth and is currently in the best possible position. What do you think, my friend? Do you think Solana can go up?

EUR/USD - BUY BUY BUY!Here in my personal Opinion I can see a few potential reasons to buy with high confidence.
Firstly- Weekly timeframe is showing a Bullish movement with us closing last week with a strong volume candle.
Secondly- On the Daily time frame we can see this is a high possibility of a 5th leg of elliots wave to finish this Bullish run.
Thirdly- The Daily has pushed out of the 71% level from the first demand zone. Following this on the 4H Time frame we can notice this previous push has also giving a strong Liqudity Grab into the new 71% level telling me Buyers are still highly in control.
I will be looking to trade into Buy side Liquidity after this Volume gap has been filled
Follow along for more updates
