SPY $424 INBOUND NEXT!🔸️Ticker Symbol: SPY 🔸️Timeframe: 4 Hour 🔸️Investment Strategy: Long
TECHNICAL ANALYSIS: SPY is currently in a 4X bull pattern meaning all 4 of our indicators are pointing in an upward direction. Money movement is shifting higher, our middle band on the dashboard has shifted from red to green, we have a green dot meaning a key ema crossover to the upside and we are also in a bull regression trend. I do believe if we can hold this pattern, we could potentially see the SPY test our next deviation level at $424. Thanks for following!
🔔 Follow for daily stock, crypto and forex technical analysis.
⚠️ Trading is risky, and I understand nothing is guaranteed. Proper risk management should be in place at all times to minimize losses. Please consult a financial advisor before trading. All Inclusive Trading LLC is not a financial advisor and may not be held liable for any losses which may occur.
Buysellsignal

MSFT Don't Miss This Move!🔸️Ticker Symbol: MSFT 🔸️Timeframe: 4 Hour 🔸️Investment Strategy: Long
TECHNICAL ANALYSIS: MSFT is currently sitting on a strong level support at $276. We are in a bull regression trend which is why I want to be focusing on long position in the market at the moment. We do have our bottom dashboard indicator suggesting that we are in a buying or accumulating stage in the market since we are testing this bottom green section. Historically this area in a bull trend has acted as a good indication that MSTF could see a push higher in value. If we do continue in this trend, I do believe a retest of $290 is not out of the question come next week. Thanks for following.
🔔 Follow for daily stock, crypto and forex technical analysis.
⚠️ Trading is risky, and I understand nothing is guaranteed. Proper risk management should be in place at all times to minimize losses. Please consult a financial advisor before trading. All Inclusive Trading LLC is not a financial advisor and may not be held liable for any losses which may occur.

AAPL Signaling Bullish Continuation 🔸️Ticker Symbol: AAPL 🔸️Timeframe: 4 Hour 🔸️Investment Strategy: Long
TECHNICAL ANALYSIS: AAPL is looking promising to end the week strong to the upside. I do think if we can stay in this bull trend, we could potentially see AAPL hit $175 either tomorrow August 26 or early next week. Our bottom dashboard indicator does suggest that money is still flowing into the market, along with a green dot illuminated representing a key ema crossover to the upside. With both of these indicators pointing to bullish signs I do think if we can hold support at $168 AAPL does have the ability to retest its previous resistance level around $175. Thank you for following!
🔔 Follow for daily stock, crypto and forex technical analysis.
⚠️ Trading is risky, and I understand nothing is guaranteed. Proper risk management should be in place at all times to minimize losses. Please consult a financial advisor before trading. All Inclusive Trading LLC is not a financial advisor and may not be held liable for any losses which may occur.

TSLA BREAK OF WEDGE COULD RESULT IN RETEST OF $1000🔸️Ticker Symbol: TSLA 🔸️Timeframe: 4 Hour 🔸️4X Bull Pattern🔸️Investment Strategy: Neutral
TECHNICAL ANALYSIS: TSLA is currently in a 4X bull pattern. This means all 4 of our indicators are pointing in the same direction. Our linear regression indicator is in a bullish pattern, our money momentum indicator is shifting higher, we have a green dot representing a key ema crossover to the upside and lastly out middle band is displaying bull market momentum. If we can break out about this wedge formation on the 4H timeframe I do believe we could potentially see TSLA test the $1000 mark again in the coming weeks. Thanks for following!
🔔 Follow for daily stock, crypto and forex technical analysis.
⚠️ Trading is risky, and I understand nothing is guaranteed. Proper risk management should be in place at all times to minimize losses. Please consult a financial advisor before trading. All Inclusive Trading LLC is not a financial advisor and may not be held liable for any losses which may occur.

SPY Technical Update 8/24/22🔸️Ticker Symbol: SPY 🔸️Timeframe: 4 Hour 🔸️Investment Strategy: Neutral
TECHNICAL ANALYSIS: SPY looks to be setting up for a nice push to the upside if we can hold this level of support at $412. We are testing the bottom deviation level on our bull regression trend which in the past has acted as a strong level of support. We also have our white line which is money movement shifting to the upside. The key metric I want to keep an eye on is our middle band on the dashboard to switch from red meaning bearish momentum to green meaning bullish momentum giving us additional confirmation that the SPY could potentially see a bounce play back up to around the $430 level. Thanks for following!
🔔 Follow for daily stock, crypto and forex technical analysis.
⚠️ Trading is risky, and I understand nothing is guaranteed. Proper risk management should be in place at all times to minimize losses. Please consult a financial advisor before trading. All Inclusive Trading LLC is not a financial advisor and may not be held liable for any losses which may occur.

SOFI Dip and Rip Pattern🔸️Ticker Symbol: SOFI 🔸️Timeframe: 4 Hour 🔸️Investment Strategy: Long
TECHNICAL ANALYSIS: SOFI Stock on 8/24 had a great push to $6.87 and is currently experiencing a slight pullback to approx $6.40. The couple metrics I want to keep an eye on is our linear regression indicator and also our bottom dashboard indicator to make sure that money is continuing to flow into SOFI and that we stay above the bottom deviation level on our bull regression trend. If we can hold support at $6.03 and not break below this stock could potentially see a push to $7.15 in the coming week! Thank you for following!
🔔 Follow for daily stock, crypto and forex technical analysis.
⚠️ Trading is risky, and I understand nothing is guaranteed. Proper risk management should be in place at all times to minimize losses. Please consult a financial advisor before trading. All Inclusive Trading LLC is not a financial advisor and may not be held liable for any losses which may occur.

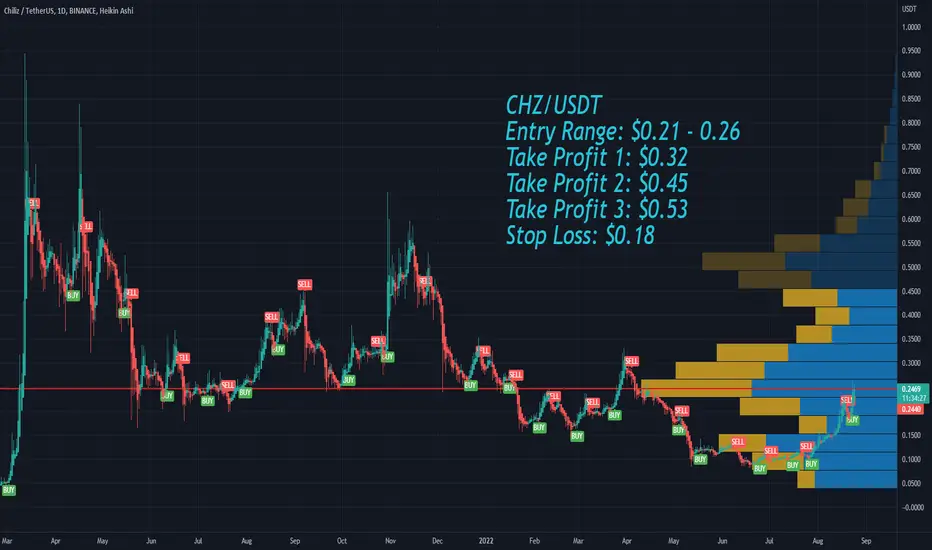
Chiliz CHZ Entry Range, Take Profit and Stop LossCHZ/USDT
Entry Range: $0.21 - 0.26
Take Profit 1: $0.32
Take Profit 2: $0.45
Take Profit 3: $0.53
Stop Loss: $0.18
NVDA Technical Update 8/23/22🔸️Ticker Symbol: NVDA 🔸️Timeframe: 4 Hour 🔸️Investment Strategy: Neutral
TECHNICAL ANALYSIS: NVDA has a massive doji candle on the 4H timeframe. This means we currently have indecision in the market and the stock is trying to figure out which way it wants to proceed. I do want to draw your attention to a couple key metrics on our indicators. The white line on the bottom dashboard which represents money momentum is making a higher low after the price previously tested a major level of support at approx. $167. This does indicate we could see a push higher since the overall money that is flowing into the market is increasing in value. We are also testing a bottom deviation level on our regression trend indicator which historically has acted as a strong level of support.
The take profit area on this stock if we continue to rise in value would be around the $181 area which is the largest level of resistance. However if we do see a push lower I would keep a close eye on the $158 support level to take profit if you decide to short NVDA. Thank you for watching and please let me know what your personal investment strategy is for NVDA. Have a great day!
🔔 Follow for daily stock, crypto and forex technical analysis.
⚠️ Trading is risky, and I understand nothing is guaranteed. Proper risk management should be in place at all times to minimize losses. Please consult a financial advisor before trading. All Inclusive Trading LLC is not a financial advisor and may not be held liable for any losses which may occur.

TSLA Technical Update 8/23/22🔸️Ticker Symbol: TSLA 🔸️Timeframe: 4 Hour 🔸️Investment Strategy: Long
TECHNICAL ANALYSIS: TSLA is setting up nicely to see a push higher if we can hold this level of support at $860. We can tell that we are testing the bottom deviation level on our regression trend indicator which historically has acted as a level of support in the market. Price at the moment is increasing in value along with our money momentum indicator on the bottom dashboard. When we have a middle band that is flashing red, and our money momentum is down in the green buying zone or accumulation stage... this previously has indicated that we could see a nice shift to the upside if we can hold support at $860.
Now anything is possible so if we do end up heading lower keep an eye out for the $838 level which is the strongest level of support for a bounce play. Thank you for following. Please let me know what your personal investment strategy is for TSLA. Take care!
🔔 Follow for daily stock, crypto and forex technical analysis.
⚠️ Trading is risky, and I understand nothing is guaranteed. Proper risk management should be in place at all times to minimize losses. Please consult a financial advisor before trading. All Inclusive Trading LLC is not a financial advisor and may not be held liable for any losses which may occur.

NVDA: WATCH THIS KEY LEVEL! 🔸️Ticker Symbol: NVDA 🔸️Timeframe: 4 Hour🔸️Investment Stratey: Short
TECHNICAL ANALYSIS: NVDA is currently selling off in the market but could potentially see a bounce play incoming. The largest level of support for NVDA sits at about $166. This area also acts as a bottom deviation level on our bull Regression Trend Indicator.
If we take a look at our bottom dashboard we can see that our white line representing Money Momentum is still shifting out of the market and not yet making a higher low. We also have our middle band showing red meaning Bear Market Momentum. This is why I believe we could potentially see a test of $166 before a bounce play back upwards. Please let me know your personal investment strategy and thanks for following!
🔔 Follow for daily stock, crypto and forex technical analysis.
⚠️ Trading is risky and I understand nothing is guaranteed. Proper risk management should be in place at all times to minimize losses. Please consult a financial advisor before trading. All Inclusive Trading LLC is not a financial advisor and may not be held liable for any losses which may occur.

TSLA: BOUNCE PLAY INCOMING!🔸️Ticker Symbol: TSLA 🔸️Timeframe: 4 Hour 🔸️Investment Stratey: Short/ Long
TECHNICAL ANALYSIS: TSLA is about to test a major support level at $838 in this current down trend. This area also acts as the bottom deviation level on our regression trend indicator which is currently in a bull trend overall.
Down on our dashboard we can see that our middle band has shifted to red meaning bear market momentum however our white line representing money movement is starting to shift a bit higher. This indicates that we could possibly see a push higher after testing this support area around $838. Let me know your personal investment strategy and thanks for following.
🔔 Follow for daily stock, crypto and forex technical analysis.
⚠️ Trading is risky and I understand nothing is guaranteed. Proper risk management should be in place at all times to minimize losses. Please consult a financial advisor before trading. All Inclusive Trading LLC is not a financial advisor and may not be held liable for any losses which may occur.

AAPL: BREAK OF SUPPORT COULD SEE $164🔸️Ticker Symbol: AAPL 🔸️Timeframe: 4 Hour 🔸️2X Bear Pattern 🔸️Investment Stratey: Short
TECHNICAL ANALYSIS: AAPL is currently in a 2x bear pattern on the 4H timeframe. We have our dashboard showing that our money momentum is still flowing out of the market along with our middle band shifting from bull market momentum over to bear market momentum. If we do end up breaking below this level of current support at approximately $169 we could see AAPL flush down to the $164 level. Please comment below your personal investment strategy for AAPL. Thanks for following!
4X 🔴 Bear Pattern Confirmation Requirements
🔻 Linear Regression Indicator Declining
🔻 Money Momentum Shifting Lower
🔻 Red Dot: Key EMA Crossover To Downside
🔻 Red Middle Band: Bear Market Momentum
🔔 Follow for daily stock, crypto and forex technical analysis.
⚠️ Trading is risky and I understand nothing is guaranteed. Proper risk management should be in place at all times to minimize losses. Please consult a financial advisor before trading. All Inclusive Trading LLC is not a financial advisor and may not be held liable for any losses which may occur.

$MSFT: CTRL, ALT, DEL 🩸🔸️Ticker Symbol: MSFT 🔸️Timeframe: 4 Hour 🔸️Investment Stratey: Short
TECHNICAL ANALYSIS: $MSFT has recently broken out of a rising wedge pattern on the 4H timeframe. We also have our bottom dashboard indicating money momentum is still shifting out of the market and a middle band flashing red meaning bear market momentum. The strongest level of support for $MSFT is curreny $277.55. ( Current Price $285.00)
Have an amazing Sunday!
🔔 Follow for daily stock analysis using Trendsi ATS.
⚠️ Trading is risky and I understand nothing is guaranteed. Proper risk management should be in place at all times to minimize losses. Please consult a financial advisor before trading. All Inclusive Trading LLC is not a financial advisor and may not be held liable for any losses which may occur.

SPY: MAKE OR BREAK TIME💥🔸️Ticker Symbol: $SPY 🔸️Timeframe: 4H 🔸️Investment Strategy: Neutral
TECHNICAL ANALYSIS: $SPY is currently at a very critical level in the market at $423. Two scenarios can play out in my opinion. If we do reject off the middle deviation level on our bull regression trend indicator, I can see the SPY increasing to its previous resistance level of $425. However, if we do end up breaking below this level of $421 the next levels of support are not until $416 and then $412. Leave comments below on what investment strategy you are playing!
🔔 Follow for daily stock, crypto and forex technical analysis.
⚠️ Trading is risky, and I understand nothing is guaranteed. Proper risk management should be in place at all times to minimize losses. Please consult a financial advisor before trading. Trendsi Trades LLC is not a financial advisor and may not be held liable for any losses which may occur.

$BAC DUMPING AS EXPECTED 🩸🔸️Ticker Symbol: $BAC 🔸️Timeframe: 4H 🔸️3X Bear Pattern 🔸️Investment Strategy: Short
TECHNICAL ANALYSIS: $BAC is currently in a 3X bear pattern. This means all three of our indicators are pointing in the same direction. We have our money momentum heading lower, a red dot meaning a key ema crossover and also our middle band has now shifted over from green to red representing bearish marker momentum. If we can continue in this 3x bear pattern, I do believe we can see a test of approximately $34.90 which would be our middle line on the regression tend indicator.
🔔 Follow for daily stock, crypto and forex technical analysis.
⚠️ Trading is risky, and I understand nothing is guaranteed. Proper risk management should be in place at all times to minimize losses. Please consult a financial advisor before trading. Trendsi Trades LLC is not a financial advisor and may not be held liable for any losses which may occur.

$UNH HERE WE GO 🚀🔸️Ticker Symbol: $UNH 🔸️Timeframe: 4H 🔸️4X Bull Pattern 🔸️Investment Strategy: Long
TECHNICAL ANALYSIS: $UNH is currently breaking a strong resistance level in the market at $548.58. I do believe if we can continue in this 4X bull pattern we could potentially see $560 next week on $UNH. Let me know what your investment strategy is.
4X 🟢 Bull Pattern Confirmation Requirements
✅️ Linear Regression Indicator Increasing
✅️ Money Momentum Shifting Higher
✅️ Green Dot: Key EMA Crossover to Upside
✅️ Green Middle Band: Bull Market Momentum
4X 🔴 Bear Pattern Confirmation Requirements
🔻 Linear Regression Indicator Declining
🔻 Money Momentum Shifting Lower
🔻 Red Dot: Key EMA Crossover To Downside
🔻 Red Middle Band: Bear Market Momentum
🔔 Follow for daily stock, crypto and forex technical analysis.
⚠️ Trading is risky, and I understand nothing is guaranteed. Proper risk management should be in place at all times to minimize losses. Please consult a financial advisor before trading. Trendsi Trades LLC is not a financial advisor and may not be held liable for any losses which may occur.

SPY: MAKING A PUSH TO $430!🔸️Ticker Symbol: SPY 🔸️Timeframe: 1 Hour 🔸️4X Bull Pattern 🔸️Investment Stratey: Long
TECHNICAL ANALYSIS: The spy is currently in a 4X bull pattern meaning our linear regression indicator is pointing in an upper direction, our money movement indicator on the bottom is shifting higher, we have a green dot representing a key EMA crossover and our middle band on the dashboard representing market momentum has switched over from red to green meaning bullish momentum. I do want to see if the spy can test $430 or close to it by the end of today August 18th and then a continuation next week. Let me know your thoughts.
4X 🟢 Bull Pattern Confirmation Requirements
✅️ Linear Regression Indicator Increasing
✅️ Money Momentum Shifting Higher
✅️ Green Dot: Key EMA Crossover to Upside
✅️ Green Middle Band: Bull Market Momentum
4X 🔴 Bear Pattern Confirmation Requirements
🔻 Linear Regression Indicator Declining
🔻 Money Momentum Shifting Lower
🔻 Red Dot: Key EMA Crossover To Downside
🔻 Red Middle Band: Bear Market Momentum
🔔 Follow for daily stock, crypto and forex technical analysis.
⚠️ Trading is risky and I understand nothing is guaranteed. Proper risk management should be in place at all times to minimize losses. Please consult a financial advisor before trading. All Inclusive Trading LLC is not a financial advisor and may not be held liable for any losses which may occur.

$UNH ON THE VERGE OF A BREAKOUT? 🔸️Ticker Symbol: $UNH 🔸️Timeframe: 4H 🔸️Investment Strategy: Long
TECHNICAL ANALYSIS: $UNH is currently trading at a very crucial level in the market sitting at $548.58. Historically looking left this area has acted as a strong level of resistance. However, if $UNH can push higher and break though this area of resistance, I do believe we could see the price of $UNH continue to approx. $560. We also have our money movement indicator pushing higher along with the middle band on the dashboard showing green bullish momentum so if something is going to happen it should be soon. Let me know what you think in the comments.
🔔 Follow for daily stock, crypto and forex technical analysis.
⚠️ Trading is risky, and I understand nothing is guaranteed. Proper risk management should be in place at all times to minimize losses. Please consult a financial advisor before trading. Trendsi Trades LLC is not a financial advisor and may not be held liable for any losses which may occur.

$BAC IS THE RALLY OVER 📉🔸️Ticker Symbol: $BAC 🔸️Timeframe: 4H 🔸️Investment Strategy: Short
TECHNICAL ANALYSIS: $BAC Post earning has increased in value 24.24% at its max. Is this rally sustainable? If we take a look at our linear regression indicator it suggests we are in the top deviation level. Now historically when we have entered this area, we have seen a nice move lower on $BAC. We also have our white line on the dashboard representing "money movement" shifting lower while the price of the stock is currently still increasing. This is known as divergence. With all of these indications sounding at the same time I do believe we could potentially see a nice selloff on $BAC in the coming week. Please leave a comment below on your personal investment strategy.
🔔 Follow for daily stock, crypto and forex technical analysis.
⚠️ Trading is risky, and I understand nothing is guaranteed. Proper risk management should be in place at all times to minimize losses. Please consult a financial advisor before trading. Trendsi Trades LLC is not a financial advisor and may not be held liable for any losses which may occur.

We Called The ETH Pump!Our RSVP Extractor and Wave Strength Oscillator called these pumps perfectly! We also had a 3D ETH bullish divergence that we posted about a couple weeks ago which played out to a tee! Now I've broken down a Daily ETH chart to share my thoughts on some big support/resistance points to look out for!
1. We have a Daily trend line (red) that has been resistance since Nov 10, 2021 and coincides with the 2325 level
2. There's also major resistance at the 2125 level which coincides with the Daily 200 EMA (teal line) and the horizontal resistance from May this year (pink line)
3. The RSVP Extractor is starting to get overbought so keep watching that for any sell indications (along with the Wave Strength Oscillator)
Since both indicators don't have any strong sell signals yet, I'm expecting a continued push up until the merge to the 2300ish level. If we do pullback from here, there's some good support at 1930 and 1730 respectively.
Please make sure to only trade with what you can afford to lose. This market is extremely volatile and you never want to be caught on the wrong side.
If you have any questions about my TA or the indicators used, please leave a comment below or send me a DM. All of my links are next to my profile pic :)

NEAR Protocol NEAR Entry Range, Take Profit and Stop LossNEAR/USDT
Entry Range: $5.50 - 6.20
Price Target 1: $7.30
Price Target 2: $8.10
Price Target 3: $8.85
Stop Loss: $4.90

BNB Binance Coin Entry Range, Take Profit and Stop LossBNB/USDT
Entry Range: $320 - 340
Price Target 1: $366
Price Target 2: $388
Price Target 3: $406
Stop Loss: $285

Elrond EGLD short Entry Range, Take Profit and Stop LossEGLD/USDT short
Entry Range: $65 - 69
Price Target 1: $59
Price Target 2: $49
Price Target 3: $39
Stop Loss: $79
