ADA Poised for a Bullish Breakout? Key Levels to Watch!🔹 Current Market Structure: #ADA is moving sideways in an accumulation phase on the 1-hour timeframe, indicating potential strength for an upcoming bullish move.
🔹 Bullish Confirmation:
We are closely monitoring a breakout above the resistance level. A confirmed candle close above the accumulation zone with a successful retest would signal a strong buy opportunity.
🔹 Trading Plan:
🔹 Wait for a break and retest above the resistance.
🔹 Enter a long trade with proper risk management.
🔹 Target key resistance zones for potential profits.
🔹 What’s Your Take? Will #ADA break out or get rejected? Drop your thoughts in the comments!
🔹 Like, Comment & Follow for more real-time updates!
Buysellsignal

TONUSDTHello friends
Due to the price drop, we reached a good support area where good buyers supported the price.
Now we can buy in steps and with capital management in the specified support areas and move to the specified targets.
Always buy in fear and sell in greed.
*Trade safely with us*

US500 CHANNELHello friends
Given that the price is in an ascending channel, now that we have a strong wave to the channel ceiling, we have corrected the price by 50%, after which we can expect the price to succeed in hitting a higher ceiling again.
*Trade safely with us*

ZETA: Bullish Setup with Harmonic Pattern & Breakout Retest! Timeframe: 15-Minutes
Pattern: Harmonic Formation
Breakout & Retest Confirmation
#ZETA has formed a bullish harmonic pattern and successfully broken above resistance. Currently, it's retesting the breakout zone, a classic confirmation for a strong upside move!
Why This is a High-Probability Long Trade?
Harmonic pattern aligns with bullish momentum
Resistance breakout & retest—a textbook entry signal
Strong confluence of technical factors confirming the uptrend
Entry: At CMP 0.27 - 9.2750
Targets: 0.2890 - 2950
Stop-Loss: 0.2490
What’s your take on this setup? Are you taking this trade? Drop your thoughts in the comments!
Follow for more high-quality trade setups & insights!

XAUUSD UNEMPLOYEMENT CLAIM BREAKOUT ALERT!🚨 XAUUSD Update 🚨
🔥 Price Action: XAUUSD is locked between 3144 and 3151—breakout imminent?
📉 Bearish View: If it drops below this range, watch for targets at 3130 and 3120. Stay sharp!
📈 Bullish View: A break above 3151 could set up buying opportunities. Target 3165 and 3200.
💬 Join the Discussion: Drop your thoughts and strategies below! Let’s ride the golden wave together! 💰🚀

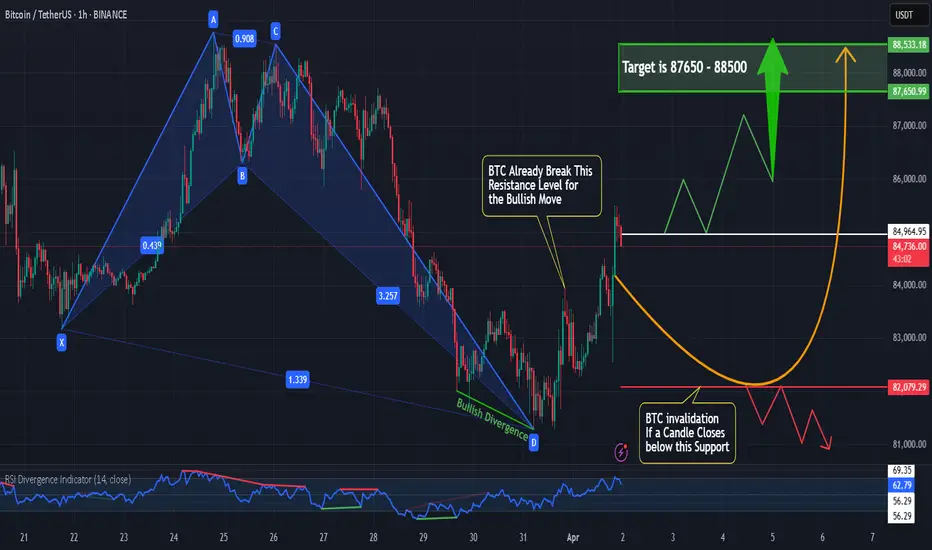
BTC Bullish Breakout Alert!🔹 Harmonic Pattern Formation on the 1H time frame
🔹 Resistance Breakout with strong bullish divergence
🔹 All signals align for a bullish trend confirmation!
Trade Idea: Enter a long position at CMP with proper risk management.
Targets: 87600 - 88500
Stop-Loss: 82000
Are you riding this move? Let me know in the comments!
#BTC #CryptoTrading #Bitcoin #PriceAction #HarmonicPatterns #BullishTrend
10-20% upside possible in fortis health Fortis health chart is too strong.. in daily chart & in weekly chart they creat very bullish patterns.
Buy fortis health at 650-668
Target 727 749 835
Sl 600

Market Update: Bullish Momentum and Key Buy Levels Near ATHHey Trader! 🚀📈
We're seeing some exciting action in the market right now! After the strong bullish bias following the GDP news, the market is clearly in an upward swing 💥. We've just witnessed the market break through the all-time high (ATH) and make a new ATH 🏆, but keep an eye on key levels for potential reversal points. 🔍
One crucial level to watch is 3080 – this could be a major turning point! Before making the higher high move, we saw the market retest the previous ATH level, and there's a significant order block near this zone, suggesting a strong buying opportunity. 📊💪
👉 BUY Setup:
- Watch for a bounce around the 3070–3080 area.
- This could be your entry for a potential rally to the upside 📈💰.
Remember, always follow proper risk management to protect your capital! 🛡️ Set your stop-losses and stay disciplined!
Happy trading, and let's catch those gains! 💸💥

INTC Intel Price Target by Year-EndIntel Corporation (INTC) has been trading near a key technical support level, forming a triple bottom on the chart—a bullish reversal pattern that suggests a potential upside move. The stock currently trades with a forward price-to-earnings (P/E) ratio of 20.44, which reflects moderate valuation levels compared to industry peers.
Intel’s turnaround strategy, focused on rebuilding its foundry business and strengthening its position in the AI and data center markets, is starting to show signs of progress. The company’s push into advanced chip manufacturing and strategic partnerships with major tech firms have positioned it for improved revenue growth in the coming quarters.
Technically, the triple bottom pattern indicates strong buying interest at current levels, reinforcing the case for a potential breakout. Combined with the improving outlook for chip demand and Intel’s strategic shift toward AI, a price target of $28 by the end of the year appears achievable. This would represent approximately 15% upside from current levels.
Investors should monitor Intel’s progress in its foundry business and AI initiatives, as any positive developments in these areas could accelerate momentum toward the $28 target.

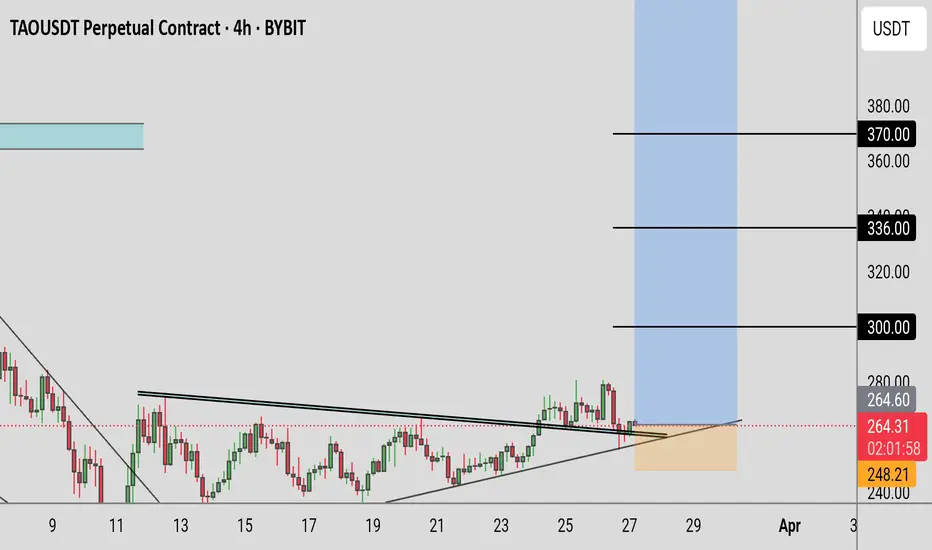
TAOUSDT Disclaimer 👉 This is my personal analysis for educational purposes , Buy/Sell/Trade at your own risk. I am not a financial Advisor
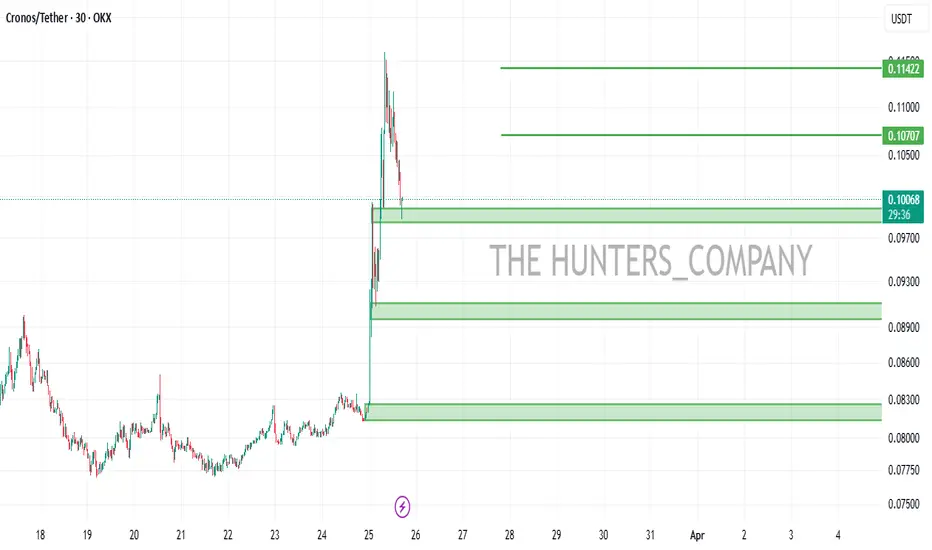
CRO/USDT : BUY LIMITHello friends
Given the good price growth, now in its correction, we can buy in steps with risk and capital management and move with it to the specified targets.
*Trade safely with us*
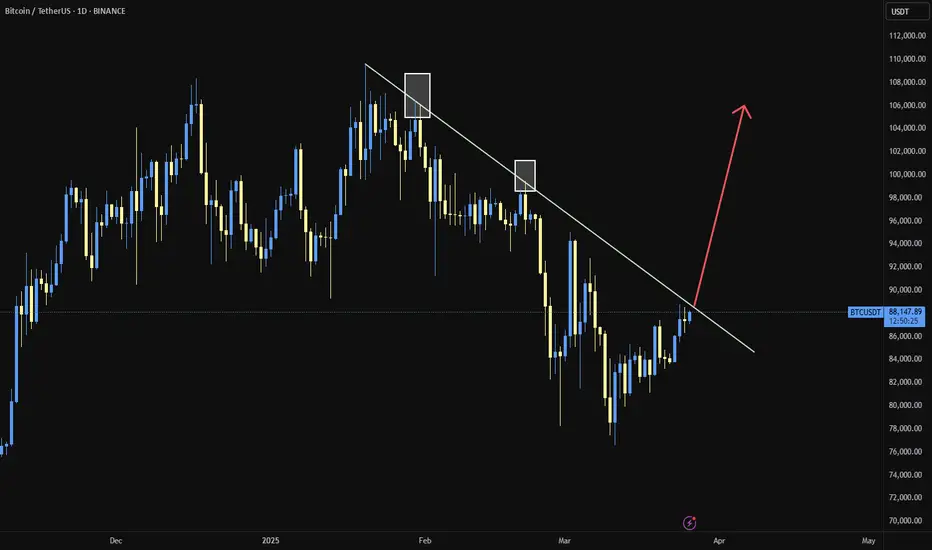
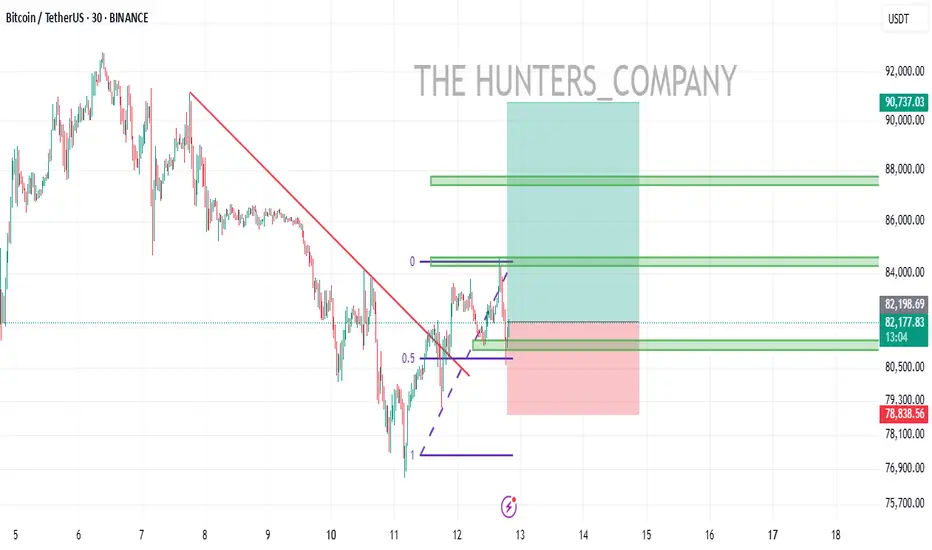
BTC/USDT"Do you think we're going up this time? I think it's taken quite a long time; we can enter a position if the resistance line breaks."
Tesla Update 2 Plan the trade and be PreparedUpdate on the Monthly chart with revised level which is worth noting on your charts and being prepared for . Enjoy the update and thanks for watching

Tesla Update 3 Whats Next after Target Long Hit Quick recap of the previous level I gave for tesla which is now + 35% off of that level . In this video I use fibs and channels + gann box .
Show your support for continued analysis with a boost and feel free to ask any questions

DOTUSDT BUY SIGNAL|Volume Profile Strategy With QM StrategyDOTUSDT BUY SIGNAL
Volume Profile Strategy With QM Strategy
buy 4.7 USDT zone
target 1 : 6.4 USDT net price 36% profit
target 2 :7.6 USDT net price 62% profit
target 3 : 9.0 USDT net price 90% profit (long time)
Enjoy
:)

this is a golden time to buy FILUSDT(136% Profit)Golden Signal :
Buy in this zone about 3.200
Sell Zone For Step 1 and Take Your profit 50% Is First Red Box ,4.333 USDT (34% Profit)
Sell Zone For Step 1 and Take Your profit 50% Is Secound Red Box, 7.578 USDT(136% Profit)
Enjoy
:)

BTC/USDTHello friends
After a heavy fall, now with the trend line broken and the ceiling and floor higher after creating a pullback, you can enter the capital with capital management.
*Trade safely with us*
POPCAT...Hello friends
Given the good price growth and the arrival of buyers, you can enter into a transaction during the price correction with capital and risk management.
*Trade safely with us*

PEPE...Hello friends
Regarding the price drop, now that buyers are supporting the price, it was entered within the specified support ranges with capital and risk management.
*Trade safely with us*

SOL/USDT: UPDATE SIGNALHello friends
You can see that after the price fell in the specified support area, buyers came in and supported the price and made a higher ceiling.
Now we can buy at the specified levels with capital and risk management and move with it to the specified targets.
*Trade safely with us*

Nxpi in the next few daysNxpi will be bullish in the next few days
we will see very strong movement in the next few days for this stock

Start adjusting before April tariff policy ! XAU ✍️ NOVA hello everyone, Let's comment on gold price next week from 03/24/2025 - 03/28/2025
🔥 World situation:
Gold prices decline for the second consecutive day but remain on track to close the week in positive territory, despite a stronger US Dollar (USD) and profit-taking ahead of the weekend. XAU/USD is currently trading at $3,019, down 0.81%.
Market sentiment remains cautious, though US equities are paring earlier losses. Meanwhile, bullion stays on the defensive as the USD regains momentum, with the US Dollar Index (DXY) edging up to 104.05, marking a 0.24% increase.
🔥 Identify:
Gold prices are in a short-term downtrend in the H4 frame, adjusting at the end of March, accumulating before tax policies in early April 2025.
🔥 Technically:
Based on the resistance and support areas of the gold price according to the H4 frame, NOVA identifies the important key areas as follows:
Resistance: $3057, $3080
Support : $2982, $2910
🔥 NOTE:
Note: Nova wishes traders to manage their capital well
- take the number of lots that match your capital
- Takeprofit equal to 4-6% of capital account
- Stoplose equal to 2-3% of capital account
- The winner is the one who sticks with the market the longest

BNB/USDTBNB$ pascal hard fork today and holding well above the 200-day EMA.
_ Expect a 10%-20% pump from here.
