LONG ON EUR/USDEUR/USD is currently at a major demand level after sweeping sell side liquidity.
The Dxy (Dollar) is overall bearish. I expect the dollar to fall and EUR/USD to rise to the previous high / supply level for over 200-300 pips.
News most likely will affect this pair in terms of volatility.
Buysetup

LONG ON NZD/USDNZD/USD is at a major demand level.
Dollar is bearish. Economic News this afternoon should assist and pushing this pair up.
Looking to catch 200 pips to the previous high.

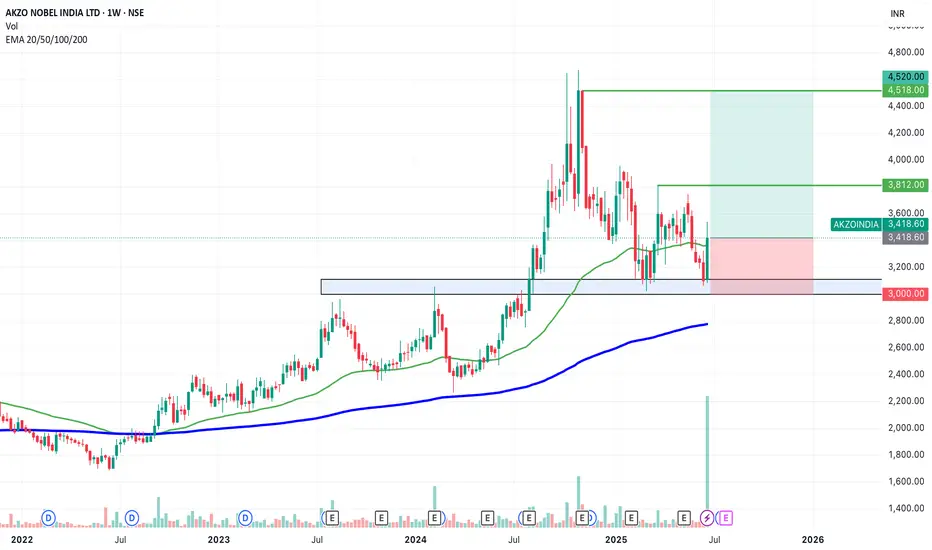
SWING IDEA - AKZO NOBEL INDIA Akzo Nobel India , a subsidiary of the global paints and coatings giant AkzoNobel N.V., is a leading player in India’s decorative and industrial paints market. Known for its premium brand Dulux , the company has strong brand recall, a wide distribution network, and consistent profitability.A strong brand, steady margins, and a bullish chart make this a candidate to watch for a short- to medium-term swing trade.
Reasons are listed below :
Bullish engulfing candle spotted on the weekly timeframe, signaling a potential trend reversal.
Accompanied by the highest-ever volume spike, adding strong conviction to the move.
Price is bouncing off the golden Fibonacci support (0.618), a classic retracement zone where strong reversals often occur.
The level of 3100 acted as a solid support.
The stock is trading above its 50 & 200 EMA on the weekly chart — a sign of long-term strength.
Target - 3812 // 4520
Stoploss - weekly close below 3000
DISCLAIMER -
Decisions to buy, sell, hold or trade in securities, commodities and other investments involve risk and are best made based on the advice of qualified financial professionals. Any trading in securities or other investments involves a risk of substantial losses. The practice of "Day Trading" involves particularly high risks and can cause you to lose substantial sums of money. Before undertaking any trading program, you should consult a qualified financial professional. Please consider carefully whether such trading is suitable for you in light of your financial condition and ability to bear financial risks. Under no circumstances shall we be liable for any loss or damage you or anyone else incurs as a result of any trading or investment activity that you or anyone else engages in based on any information or material you receive through TradingView or our services.
@visionary.growth.insights
LONG ON GBP/AUDGA has given us a CHOC (change of character) to the upside after making a new low.
Price has since pulled back to the demand area that created that change leaving us with a possible double bottom forming.
I expect GA to rise to sweep buy side liquidity at the equal highs then reaching the previous supply level / previous High.
Looking to catch 200-300 pips.

LONG ON GBP/CADGBP/CAD is now at a major key area/demand zone after completing its pullback phase.
I expect price to now rise to the next level of supply or previous high.
looking to catch 200-400 pips throughout the week.

LONG ON USOIL OIL has just completed a sweep of sell side liquidity, leaving behind lots of BUY side liquidity.
DXY is falling on top of economic news stating trump will possibly fire Jerome Powell.
All this with OPEC increase oil production.
I expect oil to make a $5-$10 move throughout the rest of the week.
That's 500-1000 pips!

SWING TRADE OPPORTUNITY 〉LONGAs illustrated, I try to visualize what the next bullish impulse could look like if price holds 3300 as a key psychological and algorithmic price level.
Illustrated are the potential buy areas (a current one and an extended one in case a pullback occurs to manipulate lower levels in the next 24-48 hours).
This projection, if valid, could hold from now until next week, so it can be considered a swing trade to hold at least the next week and into the following one).
--
After this post, I will upload another analysis on the Daily timeframe projecting the longer term move, so make sure to go in my profile to check it out.
GOOD LUCK

USDJPY 1H - market buy with a confirmed structureThe price has bounced from a key support zone and is showing early signs of recovery. A clear base has formed, and the MA50 is starting to turn upward, indicating a shift in short-term momentum. While the MA200 remains above the price, the overall structure suggests a potential continuation of the bullish move.
Trade #1 — entry at market, target: 145.939, stop below recent local low.
Trade #2 — entry after breakout and retest of 145.939, target: 148.000, stop below the retest zone.
Volume has stabilized, and the reaction from support is clear. As long as price holds above the last swing low, buying remains the preferred strategy.

LONG ON GBP/USDGU is currently in its pullback phase of its uptrend.
We have a nice sell side Liquidity sweep being completed at this moment.
Price should now tap into previous demand that broke a high to repeat history and rise again.
Very Nice Setup over 300 pips on the table to the previous high/supply zone.

LONG ON GBP/CHFGBP/CHF has tapped into a major demand zone and has lots of buy side liquidity to the upside near the supply zone to collect.
I will be buying GBP/CHF to the supply zone looking to catch 400-600 pips.

GOLD BULLS We saw gold impose a strong bullish strength since the open of this new week, and even at the beginning of the new month (JULY).
Based on this analysis, this bullish momentum has structured in a bullish trend channel which has been shown, we still have more top liquidity to mitigate as we have made a bearish retracement for a continued bullish rally to 3360's, 3380's and 3400's.
Further updates would be given as the market gains momentum
LONG ON USD/JPYUSD/JPY has given us a CHOC (change of character) from down to up.
It has engineered sell side liquidity right above a demand zone.
I expect price to sweep sell side liquidity, tap into the demand zone then take off to the upside.
looking to catch 150-250 pips on UJ. (Economic News could set this trade on Fire!)

EURGBPHigher Highs (HH) & Higher Lows (HL): The pattern of higher highs and higher lows is an indication of an uptrend, showing that the buying momentum is strong.
Entry: Place a buy stop order just above the recent higher high (HH). This allows you to enter the trade if the price continues moving upward, confirming the bullish momentum.

EURUSD – 2 Potential Intraday Setups (5-Min Chart)Chart Overview:
This 5-min EURUSD chart shows two example trade setups aligned with the main uptrend. These are shared purely for learning how to recognize and plan structured entries.
(Details are being shown in m5 chart- if this in not working for you please follow to be able to see it- as it is a private idea)
🔹 Example Trade 1 – 3rd Touch of Triangle Support
✅ Context:
Price retested the lower boundary of a broad triangle/wedge for the third time—often a strong area for reactive buys in an uptrend.
✅ Plan Concept:
Entry: Reversal signal on the 3rd touch.
Stop: Below the signal bar low.
Target: Mid to upper wedge area (or TP2).
🔹 Example Trade 2 – Breakout of Descending Flag
✅ Context:
After bouncing off trendline support, price formed a descending flag consolidation.
✅ Plan Concept:
Entry: Break and close above flag resistance.
Stop: Below the strong breakout candle.
Target: Extension toward recent highs (or TP2).
💡 Important:
These examples are not signals and not executed trades—they illustrate a possible planning process for traders studying price action strategies.
💡 Why These Matter:
Both setups align with the primary uptrend, use clear structure for risk placement, and rely on confirmation before entry.
🔹 Note:
These are educational examples only, not trade signals.
💬 Do you study similar setups? Share your charts and thoughts!
Thanks for your attention and your time...
Follow for more setups
#EURUSD #Forex #TradingEducation #PriceAction #IntradayTrading #BreakoutTrading #TechnicalAnalysis #LearnTrading #TradingView

LONG ON OILUSOIL is consolidating at a major demand area.
We have a small choc (change of character) from down to up on the lower timeframe.
I will be buying oil to the next supply level looking to catch 500-1000 pips.

BULLS HOLDING KEY PIVOT 〉ATH AROUND THE CORNER As illustrated, Im trying to visualize what a potential bull run could look like starting from what seems to be a "bullish signature" move by gold: a diagonal double bottom.
Don't believe me; go back in time and study how gold makes bottoms and how new bull runs start. The fact that it was NY that manipulated BOTH times and got the best price, is a strong footprint that MIGHT just indicate a potential bottom (at least of this current bearish correction.
I won't say "this is it" and ATH are next FROM this potential rebound; HOWEVER, it could indicate at least the next 10 to 24 hours of potential bullish impulse to retest a degree of the bearish drop since Sunday's weekly open.
Hammer candle from Tuesday's NY session low + today's 4H bullish engulfing, are also powerful components that show bullish strength indicating 3300 to be a major support area.
I'm expecting (BUT NOT ADVISING) Asia to break aggressively to the upside confirming that this could have been this current correction's bottom, and/or at least this week's low.
Should Thursday close above Tuesday's high or consolidating near it, also shows signs of bullish strength and opens the door for Friday to make a second bullish impulse move.
This would reflect on the Weekly candle leaving a long rejection wick and closing (potentially) back above 3350 - 3360.
Should this be the case, the following week would have the road paved to lift off price to retest previous 4H highs of 3440 - 3450 range.
...
July is a bullish month historically. Don't believe me; search "seasonality tool, gold" and see it for yourself.
It is a matter of weeks for Gold to breakout of this wide accumulation phase it has been since end of April, and start a fresh and brand new bull run that could/should last until the end of the year.
-
GOOD LUCK
Persa

Long OKTA To 128.50 For Nearly 30% PP. 1:2 RRR.Good Afternoon Trading Fam,
We are nailing it with our stock trades since implementing my new liquidity indicator. I've got another buy signal given here on OKTA with a 1:2 rrr ratio and potential profit of nearly 30%.
On the technical side, you can see that we are just above a large liquidity block where buyers have stepped in en masse in the past. Additionally, we have nice support being offered by our trendline. And finally, we have a large gap which often acts as a magnet and will most likely be filled sooner rather than later. The MACD has just crossed up, and our RSI is doing the same near oversold territory. All of these indications make this an easy choice for me, with an excellent opportunity to profit yet again.
More details on this trade and all of the others can be seen on my public portfolio, as always.
Best,
Stew

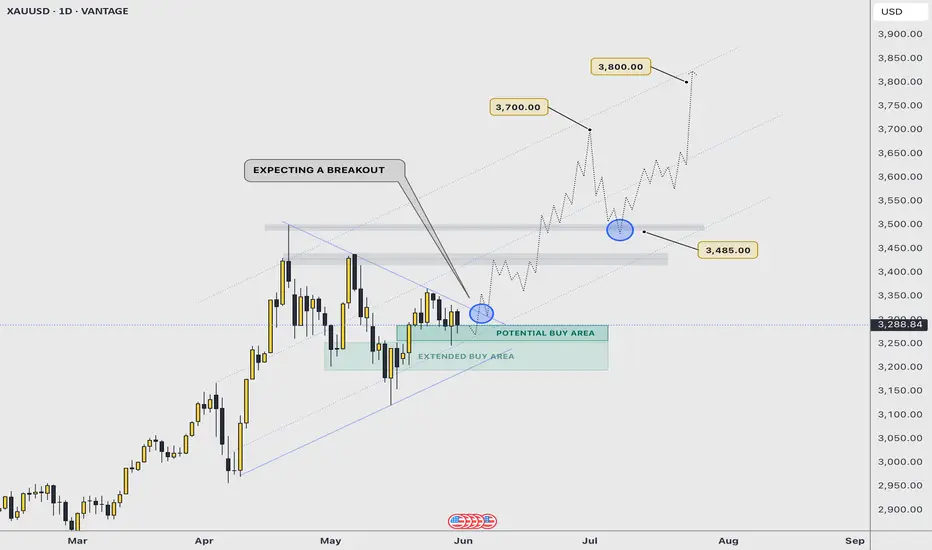
BREAKOUT SOON | $3700 - $3800 As illustrated, I’m visualising the next potential bullish continuation impulse that would take gold near the $4000 projected price.
In this idea, the path projected is based on the breakout of a rising symmetrical triangle that price formed; a strong bullish pattern that tends to be very effective when price successfully breaks out with strength.
On a fundamental aspect, things continue to hold the yellow metal on a positive route to maintain its bullish momentum and direction. Fed rates decision is getting close, and that is just the tip of the iceberg that’s going to move gold to record highs within weeks.
A key and major pivot area is near the $3200 - $3250 price range; so it’s possible we have one more attempt to break $3200.
—
GOOD LUCK
persaxu
LONG ON USD/JPYLong on UJ
- Price is respecting a major demand zone after a break and retest
- DXY (Dollar) is bullish
- Yen Bearish

GOLD BULLISH OUTLOOK📊 Gold Market Analysis – Bullish Outlook Developing
In yesterday’s market, we observed gold take out a key lower liquidity in the 3370s range. This liquidity sweep typically indicates the clearing of weak hands and positions the market for a potential reversal or continuation of a larger trend.
Following this move, gold has begun to establish a bullish trend stance, as the market structure shows signs of strength and renewed buying interest. The rejection of the 3370s level suggests that buyers are stepping in aggressively, potentially setting a solid foundation for an upward move.
From a technical perspective, this positions gold for a potential climb toward the 3440s, which serves as a short- to mid-term target. If the bullish momentum continues to build — particularly if it’s supported by favorable macroeconomic data or weakening in the U.S. dollar — we could see price action surge above the 3440s, opening up further upside potential.
This developing bullish scenario has been highlighted and discussed in the analysis. Traders and investors should monitor key support and resistance levels closely, as well as any macro developments that could reinforce or challenge this upward trajectory.

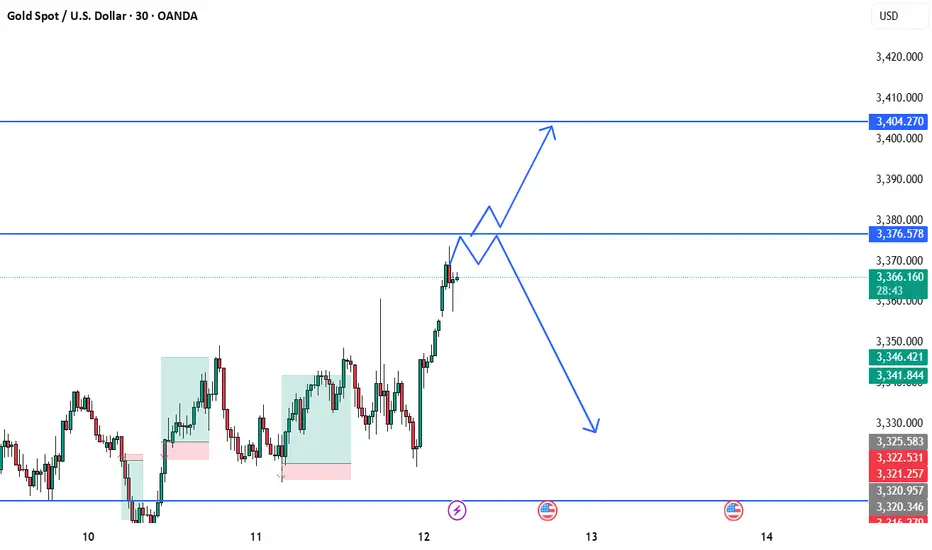
BEST XAUUSD M30 BUY AND SELL SETUP FOR TODAY Gold has shown a strong bullish push, breaking above recent consolidation and approaching a key resistance zone around $3,376. ⚔️ This area will be decisive — if price holds above it and confirms support, we could see a further rally toward $3,404. 📈✨ However, failure to sustain above this level could trigger a bearish rejection, pulling the market back toward the $3,330–$3,340 range. 📉🔄 Traders should wait for clear price action confirmation before entering. React, don’t predict! 🎯🧠
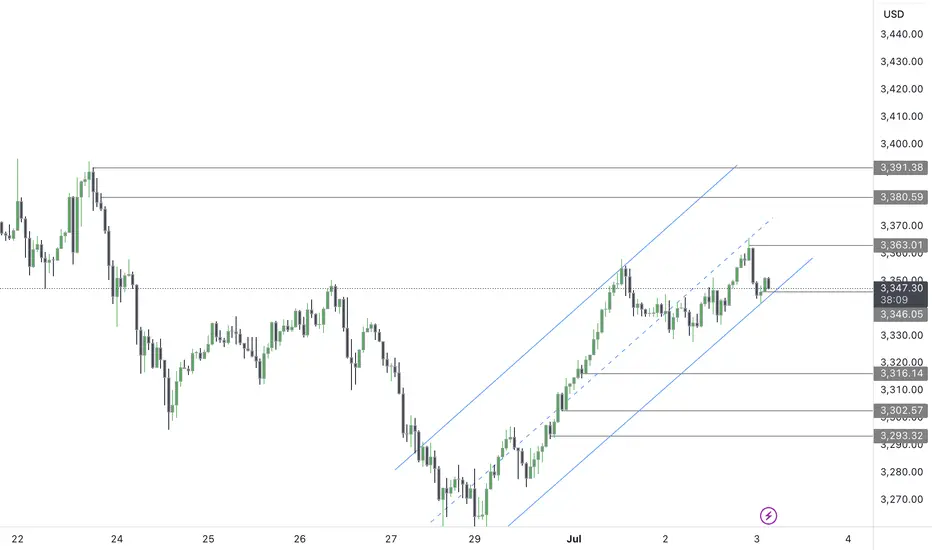
BEST XAUUSD BUY AND SELL SETUP FOR TODAY 📉📊 Gold (XAU/USD) Analysis – Key Levels in Focus! 📈🧐
Gold is currently trading around the 3,326 zone after a recent pullback. Price is approaching the key support level at 3,310, where a potential bullish bounce may occur, targeting the next resistance near 3,350. 🛑 However, if price fails to hold above 3,310, we may see further downside movement towards the 3,293 support. 📉 Traders should watch for reaction and confirmation around these zones before taking entries. ⚠️💡 A bullish reversal could trigger strong buying momentum, while a bearish break may lead to deeper correction. 🎯💰

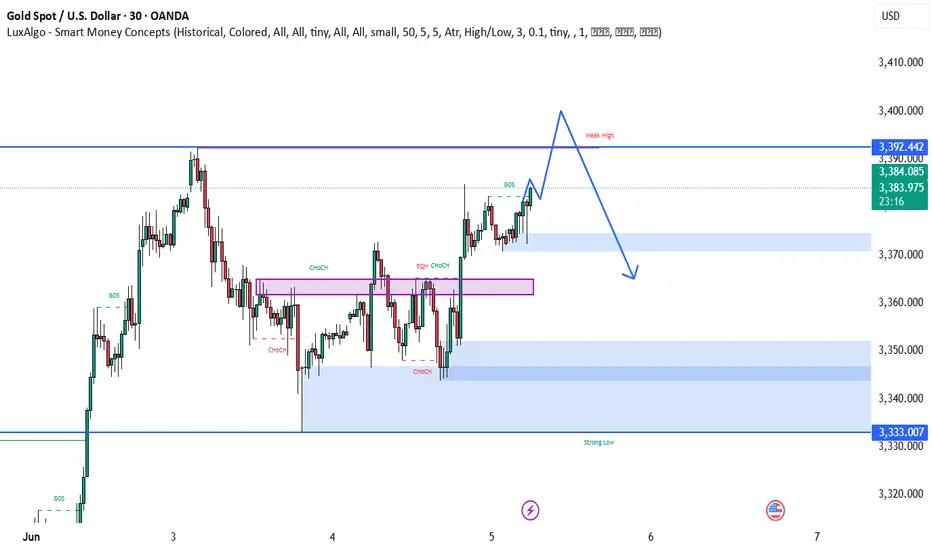
BEST XAUUSD M30 BUY AND SELL SUTUP FOR TODAY📊 Gold is currently showing bullish strength with a break above key structure levels and multiple CHoCH confirmations. Price is approaching a weak high near 3,392, which may act as a liquidity target before potential reversal. 🔄 After sweeping this high, a bearish move could unfold, aiming for the demand zones between 3,350–3,333 where buyers may step back in. 🧠 Traders should prepare for a liquidity grab scenario, with bullish continuation likely invalidated if price closes below the strong demand. ⚠️ Watch price action closely near the weak high and key imbalance zones. 🚀🔁📉