GoldViewFX - Market UPDATEHey Everyone,
As you can see our roadmap has been playing out level to level with targets not only getting HIT but in order.
We were expecting movement down to support zone identified on the chart, which we took with a signal and then, as per our chart idea, we saw price bounce off to target 1822 Goldturn.
We have a candle body close above 1822 Goldturn, which opens 1836 again, however this is without EMA5 cross, so not as strong. However we have all MA's converging together, which usually happens before a breakout and we have ma200 sitting just above close to 1836 away from all the converging MA's, which may get magnetised for a HIT, strengthening the 1836 TARGET.
We also have a candle body close below 1811 opening 1804 for a lower target. As you can see the converging MA's are creating gaps in both directions, which happens when price ranges side by side in a tight range.
BULLISH TARGETS
1822, 1836, 1847, 1861
BEARISH TARGETS
1811, 1804, 1797, 1788
We will look for EMA5 cross and lock with candle body close to determine direction level to level and we will use our daily intraday levels that we share for exits and entries.
Please don't forget to like, comment and follow to support us, we really appreciate it!
GoldViewFX
XAUUSD TOP AUTHOR
Buysetup

$PPSIPioneer Power Solutions, Inc., together with its subsidiaries, designs, manufactures, sells, and services electric power systems, distributed energy resources, used and new power generation equipment, and mobile EV charging solutions in the United States, Canada, and internationally. The company operates in two segments, Transmission & Distribution Solutions and Critical Power Solutions. The Transmission & Distribution Solutions segment provides electric power systems, including e-Bloc, and distributed energy resources that help customers effectively and efficiently protect, control, transfer, monitor, and manage their electric energy requirements. It also provides low voltage switchgears and transfer switches. The Critical Power Solutions segment provides new and used power generation equipment, and aftermarket field-services to ensure smooth and uninterrupted power to operations during times of emergency. The company serves utility, industrial, commercial, and backup power markets. The company was incorporated in 2008 and is headquartered in Fort Lee, New Jersey. Pioneer Power Solutions, Inc. is a subsidiary of Provident Pioneer Partners, L.P.

$CYNCyngn Inc., an autonomous vehicle (AV) technology company, develops autonomous driving software. The company is developing Enterprise Autonomy Suite, which consists of DriveMod, a modular industrial vehicle autonomous driving software; Cyngn Insight, a customer-facing tool suite for monitoring and managing AV fleets and aggregating/analyzing data; and Cyngn Evolve, an internal tool suite and infrastructure that facilitates artificial intelligence and machine learning training to enhance algorithms and models, and provides a simulation framework to ensure that data collected in the field can be applied to validating new releases. Cyngn Inc. was incorporated in 2013 and is headquartered in Menlo Park, California.

$HCDIHarbor Custom Development, Inc. operates as a real estate development company in Washington, California, Texas, and Florida. The company is involved in land acquisition, entitlements, development, construction of project infrastructure, single and multi-family vertical construction, marketing, sales, and management of various residential projects. It undertakes projects, such as residential lots, home communities, townhomes, and multi-story condominium or apartment properties The company was formerly known as Harbor Custom Homes, Inc. and changed its name to Harbor Custom Development, Inc. in August 2019. Harbor Custom Development, Inc. was incorporated in 2014 and is based in Gig Harbor, Washington.

$SQZ SQZ Biotechnologies Company, a clinical-stage biotechnology company, develops cell therapies for patients with cancer, autoimmune, infectious diseases, and other serious conditions. Its lead product candidate is SQZ-PBMC-HPV, from its SQZ Antigen Presenting Cells platform, which is in a Phase I clinical trial as a monotherapy and in combination with other immuno-oncology agents for the treatment of HPV16+ advanced or metastatic solid tumors, including cervical, head-and-neck, anal, penile, vulvar, and vaginal cancer. The company also develops SQZ-AAC-HPV, which is in a Phase I clinical trial for the treatment of HPV16+ advanced or metastatic solid tumors in monotherapy and in combinations with other immune-oncology agents. Its additional platforms in development are SQZ Activating Antigen Carriers; and SQZ Tolerizing Antigen Carriers. SQZ Biotechnologies Company was incorporated in 2013 and is headquartered in Watertown, Massachusetts.

GoldViewFX - UPDATED LEVELS & TARGETS$Hey Everyone,
We had another smashing day today with a buy signal with the perfect exit using our custom intraday levels to then follow with a sell signal. Both signals HIT target and out! The market continued to break through levels, as we anticipated this yesterday highlighting the lower levels being open and to consider this while chasing any bull targets.
We have had a weekly chart MA83 touch, which may provide some dynamic support. We have now drawn a Goldturn channel, which highlights a upper challenge at 1851 and a lower challenge at 1793. We need to consider this range while trading Goldturn to Goldturn.
Bullish TARGETS
1825, 1842, 1851
BEARISH TARGETS
1814, 1804, 1793
SWING RANGE
1780
As always we will keep you updated with any changes to our plans, please don't forget to like, comment and follow to support us, we really appreciate it!
GoldViewFX
XAUUSD TOP AUTHOR


Gold Buy OppurtunityCup and Handle Pattern Formed on 15M chart presenting a Buy oppurtunity for Intraday Traders.

GoldViewFX - MARKET UPDATEHey Everyone,
We had an awesome day today with our trading plan playing out to perfection!!! (see related post below)
We hit all our projected targets from retracement to 1832 to find support, as identified - followed by 1839, 1844, 1849, 1854, and then to finish of with a BOOM 1857.
Why do we stick to buys I hear a lot of you ask? well I've been trading the Gold market for over 10 years and have traded and managed most market conditions. Every so often a winning streak is broken with getting stuck in a big swing. Back test the Daily chart structure and you will see getting stuck in a swing with buys is far safer than a sell swing. The last 3 years I have found it both safer and profitable to have a 70/30 ratio with buys vs sells.
The lower range has opened up so we must keep that in mind while taking buys and manage risk accordingly. Markets are volatile so we expect swings both ways.
We expect some retracement and then continuation of movement up.
BULLISH TARGETS
1854, 1857, 1863
BEARISH TARGETS
1849,1844
SWING RANGE
1832
As always we will keep you all updated with any changes to our plans throughout the day. Please don't forget to like, comment and follow to support us, we really appreciate it!
GoldViewFX
XAUUSD TOP AUTHOR

USD 100 INDEXIs usd index going up??
Judging by what I see,it looks like usd index is gaining some momentum,just not sure but a long is what I see coming forth. Leave your comment or analysis in the comments below😊

$RDBXRedbox Entertainment Inc. operates a network of self-service kiosks in the United States. It operates a network of approximately 38,000 self-service kiosks, where consumers could rent or purchase new-release DVDs and Blu-ray Discs. The company provides installation, merchandising, and break-fix services to other kiosk businesses. It also produces, acquires, and distributes movies through its film distribution label, Redbox Entertainment, LLC, providing rights to talent-led films that are distributed across the company's services, as well as through third party digital services. In addition, the company offers transactional and ad-supported digital streaming services, which include Redbox On Demand, a transactional service that provides digital rental or purchase of new release and catalog movies and TV content; Redbox Free On Demand, an ad-supported service providing free movies and TV shows on demand; and Redbox Free Live TV, an ad-supported television service giving access to approximately 100 linear channels. The company is based in Oakbrook Terrace, Illinois.

GoldViewFX - MARKET UPDATEHey Everyone,
Quick update on todays movement. We saw Gold move down today with strong momentum. Each level was confirmed using EMA5 cross and lock and fulfilled the gaps. Well done for anyone taking advantage of this movement. We did not take advantage of this movement down as we remain Bullish waiting for the right entries.
We cam see price is challenging the daily chart Goldturn trendline and hoping it find support here. If momentum continues we can see this go as low as 1835 for support otherwise we should see some movement back up.
We will watch the daily chart closely for a break in the structure and setup. Please don't forget to like, comment and follow to support us.
GoldViewFX
XAUUSD TOP AUTHOR

Eth/usdt Buying StrategyYou can buy Eth with in this Price And Earn lots of Profit Follow us For More New update

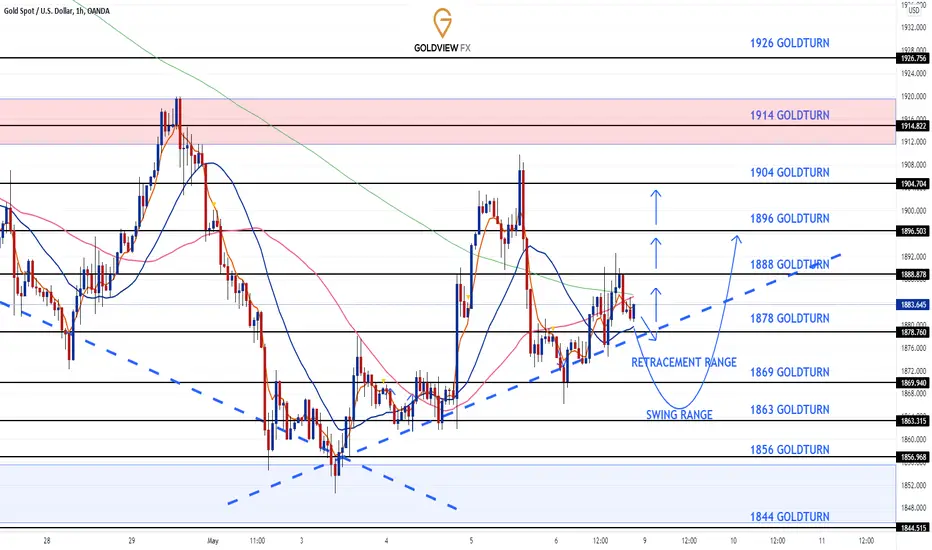
GoldViewFX - 1H CHART UPDATED LEVELS & TARGETSHey Everyone,
Please see updated Goldturns and Targets for the 1H chart.
We will be looking for EMA5 cross on the Goldturns followed with a candle body close to confirm the next level.
Bullish TARGETS
1888, 1896, 1904
RETRACEMENT RANGE (layering range)
1878 - 1869
SWING RANGE (risk management range)
1863
We plan on buying from drops to support levels and taking 20 to 30 pips at a time to avoid getting stuck in swings. We will also be using EMA5 cross and lock to confirm targets to each level before starting to layer entries from support.
As always we will keep our followers updated with daily updates. Please don't forget to like, comment and follow to support us, we really appreciate it!
GoldViewFX
XAUUSD TOP AUTHOR
GoldViewFX - WEEKLY CHART UPDATEHey Everyone,
Please see updated weekly chart with a overall longer range target.
You can clearly see, we are still in a Bullish structure with the Goldturn trendline providing the ascending support.
Bullish TARGET
1944
SWING RANGE
1960
Please don't forget to like, comment and follow to support us.
GoldViewFX
XAUUSD TOP AUTHOR

$APEUSDTApeCoin is for the Web3 Economy
Culture has found new expression in web3 through art, gaming, entertainment, and events. The possibilities for blockchain’s impact on culture are so endless that they can’t possibly all be predicted yet. APE is a token made to support what’s next, controlled and built on by the community. It will serve as a decentralized protocol layer for community-led initiatives that drive culture forward into the metaverse. Yuga Labs is a web3 company best known for the creation of the Bored Ape Yacht Club. It will be a community member in the ApeCoin DAO and will adopt APE as the primary token across new projects.
The Ape Foundation
The APE Foundation is the steward of ApeCoin. It is not an overseer, but the base layer on which ApeCoin holders in the ApeCoin DAO can build.
The Foundation facilitates decentralized and community-led governance and is designed to become more decentralized over time. It is tasked with administering the decisions of the ApeCoin DAO, and is responsible for day-to-day administration, bookkeeping, project management, and other tasks that ensure the DAO community’s ideas have the support they need to become a reality.
The goal of the APE Foundation is to steward the growth and development of the APE ecosystem in a fair and inclusive way. It utilizes the Ecosystem Fund, which is controlled by a multisig wallet, to pay its expenses as directed by the ApeCoin DAO and provides an infrastructure for ApeCoin holders to collaborate through open and permissionless governance processes.
The DAO
ApeCoin DAO exists because decentralized governance is critical to building and managing a globally dispersed community—and therefore critical to the success of the APE ecosystem.
The APE Improvement Proposal Process (see Governance) will allow ApeCoin DAO members to make decisions regarding Ecosystem Fund allocations, governance rules, projects, partnerships, and beyond. ApeCoin DAO membership is open to all ApeCoin holders.
The Board
A special council on the APE Foundation (the DAO’s “Board”) provides, at the behest of the ApeCoin DAO members, oversight of the Foundation administrators. The purpose of the Board is to administer DAO proposals and serve the vision of the community. It meets on proposals requiring administrative review under ApeCoin DAO rules. The initial Board serves a term of six months, after which DAO members will vote annually on Board members.
Alexis Ohanian
Co-founder of Reddit; General Partner & Founder of Seven Seven Six
Amy Wu
Head of Ventures & Gaming at FTX
Maaria Bajwa
Principal at Sound Ventures
Yat Siu
Co-founder & Chairman of Animoca Brands
Dean Steinbeck
President & General Counsel at Horizen Labs
ApeCoin Protocol
ApeCoin is an ERC-20 governance and utility token used within the APE ecosystem to empower a decentralized community building at the forefront of web3.
As the open-source protocol layer of the ecosystem, ApeCoin serves several purposes:
Governance - ApeCoin is the ecosystem’s governance token, allowing ApeCoin holders to participate in ApeCoin DAO.
Unification of Spend - ApeCoin is the ecosystem’s utility token, giving all its participants a shared and open currency that can be used without centralized intermediaries.
Access - ApeCoin provides access to certain parts of the ecosystem that are otherwise unavailable, such as exclusive games, merch, events, and services.
Incentivization - ApeCoin is a tool for third-party developers to participate in the ecosystem by incorporating APE into services, games, and other projects.

Post NFP Buy For GoldA key long-term level has held up nicely as support for GOLD since NFP dropped:
Monthly 62% Retracement, 1874.28
Looking at the 30-minute chart, the 1874 area has withstood two tests. If we get a third, it may set up a solid late-session buy. Here's the trade:
1) Buy @ 1875.1
2) Stop loss @ 1868.9
3) Profit target at 1881.3, 1:1 risk vs reward

NQ 06/05Today, all indications are that it is for sale, But with the need to pay attention. goodluck for all

XAUUSD - KOG REPORT - NFP!KOG Report NFP:
This is our view for NFP today, please do your own research and analysis to make an informed decision on the markets. It is not recommended you try to trade the event if you have less than 6 months trading experience and have a trusted risk strategy in place. The markets are extremely volatile and can cause aggressive swings in price.
We’re going to keep this brief today as its very likely we won’t be trading this release unless our key levels are hit and then we may look to take a position. So far this week we’ve hit the lower target on Gold and we’ve hit the 1913-15 target on Gold. This leaves us with two values, one above and one below that we now want to target. The level above is illustrated on the chart and is around the 1925 price region, this level we feel would represent an opportunity to take the short trade back towards the lower targets starting at 1840.
The lower target is an aggressive low which is situated around the 1825 region. A push on the price towards this level we feel would represent an opportunity to take the long trade back up to target the 1850, 1860 and above that 1880 levels. Just as we saw with the FOMC report we swung into our zone and the price reacted giving the short. This time we’ll wait again at the higher or lower regions and not get involved on the intraday levels, especially on a Friday!
Hope this helps in preparation for NFP. Please do support us by hitting the like button, leaving a comment and giving us a follow. We’ve been doing this for a long time now providing traders with in-depth free analysis on Gold, so your likes and comments are very much appreciated.
As always, trade safe.


GoldViewFX - Market UPDATEHey Everyone,
Another awesome day!!! We HIT both the TARGETS we called yesterday 1888 and 1896.
Price moved up to hit 1904 Goldturn and retraced the full movement down and now found support at the Goldturn trendline, as expected. As long as EMA5 remains above this trendline level we should see price move back up. Should EMA5 break below this trendline then we can expect the full swing range to be tested before another push up. We must consider this while managing our risk.
Bullish TARGETS
1888, 1896, 1904
RETRACEMENT RANGE
1869
SWING RANGE
1856
We will keep a close eye on this tomorrow and keep you all updated. Please don't forget to like, comment and follow to support us.
GoldViewFX
XAUUSD TOP AUTHOR

BITCOIN BREAKOUT! ABOUT TO BREAK ABOVE $40,000 and launch!BITCOIN BREAKOUT! ABOUT TO BREAK ABOVE $40,000 and launch!
its about to break $40,000 and markets will launch

GoldViewFX - UPDATED LEVELS & TARGETSHey Everyone,
Another awesome finish to today!!! All our targets from our trading plan posted yesterday 1878 and 1888 targets were HIT perfectly. We also had a pre FOMC target at 1875, which we took before FOMC and then the FOMC CANDLE gave us the TP to finish off nicely.
Bullish TARGETS
1888, 1896
RETRACEMENT RANGE
1869 - 1863
SWING RANGE
1856
DAILY CHART
Keep this chart in mind when asking why we keep buying dips. The daily chart always reminds us of the overall long term trend and the BULLISH STRUCTURE.
We will keep you posted with any changes throughout. We expect a volatile week and therefore keeping the swing range in mind to manage risk effectively.
Please don't forget to like, comment and follow to support us, we really appreciate it!
GoldViewFX
XAUUSD TOP AUTHOR
