GoldViewFX - 1H MARKET UPDATE & TARGET$$Hey All,
Hope everyone had a great weekend and had a chance to review my earlier posts on drawing Goldturn support and resistance and a basic setup on how to trade the levels (see related posts below).
Market Review
I have now drawn some weighted Goldturns using historical price action against historical levels, with some adaptations based on the market conditions. We can use EMA5 cross and lock to confirm level to level targets and I will be trading this from any deep swings and lightly from the get go without swings.
I am still Bullish and buying dips, however as mentioned before organic movement is easier to trade and catch but movement and momentum from war/fundamentals/news are difficult to trade for new traders. The swings against the market can also be as deep as the trend it drives towards. Its manipulation time for all players in the market. Trading small LOT sizes to allow flexibility to move the range is the best way to trade in these conditions.
EMA5 has crossed 1854 with the last candle of the day being the candle body close to open target to 1867. However when market closed in the middle of momentum driven movement with NEWs driving the price, we usually see a glitch open to the market, where price opens with a spike up or down away from where the market closed. Glitch open may HIT target without opportunity to enter.
We can see a retracement down to 1854 Goldturn with a swing range of 1838. I will manage my trades within the swing range. Outside of the swing range will be an area to get out and then wait for deeper corrections before buying dips again, should this happen. A break below the 1838 Gold turn can drive us down to a short term trend down, opening all the lower Targets.
Goldturn Resistance
1867
1872
1884
1897
Goldturn Support
1854
1847
1838
1831
1824
1812
Stay tuned for further analysis shortly on other timeframes and regular updates daily through the week. Any changes to our setups and plans will be updated and shared regularly.
Please don't forget to like, comment and follow us. It helps us to bring more updates to you all.
GoldViewFX
XAUUSD TOP AUTHOR
Buysetup

GBPUSD trade Idea : I will be looking for Buy Opportunity in upcoming week 14Feb - 18Feb i will focus on Long pound against Dollar .
Trade carefully , with sound Risk Management .
best of LUCK !

GoldViewFX Strategy - GOLDTURN SETUP1 - Simple & Effective Hey Everyone,
This is a follow up post from the previous post on HOW TO DRAW GOLDTURNS (see related post below)
We want to now show you how we can use the Goldturn levels and share with you all a basic yet a strong Goldturn Trading Setup in step by step stages.
1 - Draw a Goldturn on the previous days Highest point for Resistance
2 - Draw a Goldturn on the previous days Lowest point for Support
3 - Wait to now see current day price action and look to see, which level EMA5 breaks - Support or Resistance ?
4 - In this example previous days Goldturn low is broken with EMA5
5 - Once EMA5 breaks level by crossing over, we now wait for a 1H candle close after the cross. This is confirmation candle!
6 - Next candle is entry candle - we can see a 450 pip movement from entry. We advise to take profit at 50 pips or next Goldturn, which is a likely target or move SL and trail the movement to catch the entire breakout.
This is just one of the setups we thought we would share with you all. Please don't forget to like the post, it helps us bring more quality content to you all.
GoldViewFX
XAUUSD TOP AUTHOR

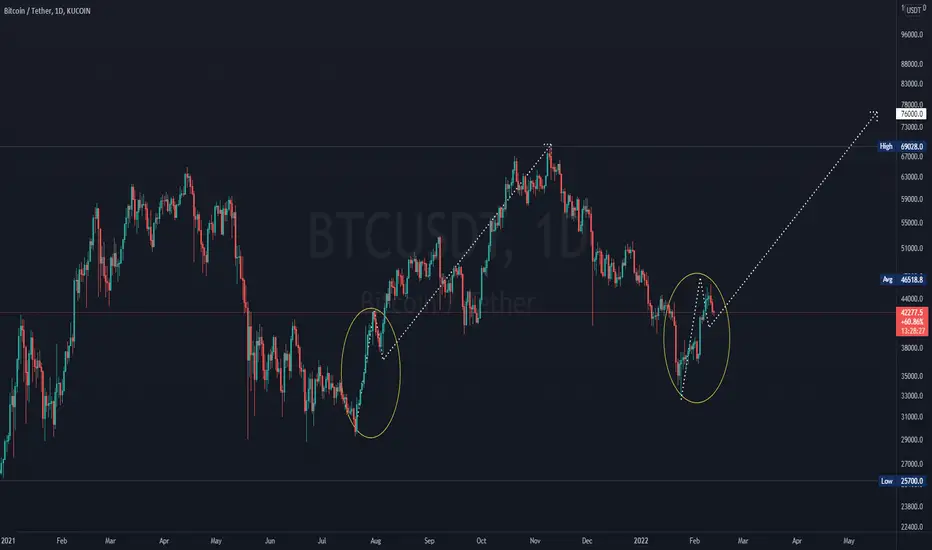
#BTC Copy-Past ? #BTC is holding well above the local zone taking all the FUD into account 🪨
We can take a look at the August scenario and it’s likely to repeat itself again 📈
GoldViewFX - How to Draw our Goldturns & Goldturn trendlines Hey Everyone,
We have been getting a lot of messages to highlight how we draw and identify Goldturns and draw Goldturn trendlines. So this post will help you all understand how we draw this and help you understand the flow of some of our analysis.
Goldturns are Support and Resistance drawn using EMA5, it helps us identify Strong levels of support and resistance levels with less noise and more concrete in their reaction to price action that is catchable. The best way to explain this; its price movement in slow motion, not too fast to analyze and catch and not too slow that price hits target before we can catch the movement. Its the SWEET SPOT for price action ! ! !
This can now be used to draw Goldturn support and resistance levels and use for intra day trading, as you would use other support and resistance levels. This can be drawn and used for m15 chart for scalping, H1, h4 chart for intra day trading and Daily chart and weekly for long term.
The Goldturn levels also allow us to use them to draw trendlines and channels that are again stronger levels to be able to identify when a channel/trendline breaks in or breaks out or is respected and allows us to negate the fake outs that we see with momentum driven candles
However what you have seen me use over the months to identify Goldturns as TARGETS and AXIS TARGETS and my SIGNALS, are my custom formula that allows me to calculate the weight of the level in terms of their strength to magnetize or repel price. This secret I have to keep to myself for now, maybe once we reach about 40,000 followers we can then open up some of this. For now this is enough for the average trader to draw and use as stronger support and resistance levels and for the Newbie trader and everybody else to be able to follow our work.
Please don't forget to like the post. The more likes we get, gives us an indication of the kind of content we should be sharing more of.
GoldViewFX
XAUUSD TOP AUTHOR

GoldViewFX - MARKET UPDATE Hey All,
And you guessed it........WE HAD ANOTHER AWESOME DAY!!!
We identified a support target at 1826 yesterday this was hit perfectly, although we saw a push below 1826, EMA5 created a Goldturn above this level confirming the support to resume back into our Bullish setup, as we suggested.
We then had 1836, 1840, 1846, 1856 ALL HIT !!!!!!!!
We can now see price enter the Goldturn channel. We need EMA5 cross or even a candle body to confirm challenge to the upper channel, as we now have an axis target 1894. I know this is pushing it !!! Everyone is expecting a Big bearish movement, including me, due to the forthcoming coming events. However back testing scenarios like this shows this can be very short sharp before something else triggers a Bullish movement again. Therefore trading small lots into March will give us the flexibility to change direction without exposing too much.
Please don't forget to like, comment and follow, we really appreciate the support.
GoldViewFX
XAUUSD TOP AUTHOR

GoldViewFX - H1 Market UPDATEHey All,
Quick update from H1 Market review (see related post below) - 1824 Target HIT after we called it yesterday identifying the resistance at the top. We expected the drop which we got and now 1828 needs to be tested and EMA5 cross and candle body close to open up another round of the Bull targets and levels above.
We are now out of trades and only taking buys from dips. If 1828 fails to cross with EMA5 then we will see 1824 and 1816.
We have had an awesome week so far and plan to ease off now. We will post further updates later so stay tuned to stay with he flow.
Please don't forget to like, comment and follow to support us,
GoldViewFX
XAUUSD TOP AUTHOR

gold short term trade rising up 1835I see the opportunity to buy gold in short term
it has a high chance of moving upward to 1835
if you like this signal please help to like and follow
thank you
Trade with care

GoldViewFX - 1H Market UPDATE 1839 TARGET HIT !!
This area is a strong resistance zone and we are likely to see some retracement and swings. 1824 is on the radar for a support TARGET.
We will not add to any longs now and banked all positions. We will consider sell signals and take buys only below 1824 to continue to try and catch the full leg
of this Bull run.
Stay tuned for regular updates and please don't forget to like the post.
GoldViewFX
XAUUSD TOP AUTHOR

GoldViewFX - 4H Market UPDATE & TARGETS$$Hey All,
I know what your all thinking......YES!! we did it again!!! 1836 and 1840 Axis Targets HIT!!. Trading it range by range helps us get out in time should the market turn against us.
We are now reaching the entrance of the next RANGEBOX 1836 - 1846 - Although we had our 1846 Target HIT, we need to see EMA5 cross and lock inside the new Rangebox. We haven't had any candle body close inside this box either. This is a sign we may see a stronger retracement. I have extended the swing range to as low as 1808 to support this.
Although we are Bullish and will continue taking buys from dips we are also now comfortable taking sell signals.
The structure remains Bullish and we can potentially see a challenge to the entrance of the Goldturn channel 1846 Goldturn and 1856 Axis. We will watch EMA5 action closely to confirm this and will keep you all updated.
Please don't forget to LIKE, COMMENT and FOLLOW to support our work.
GoldViewFX
XAUUSD TOP AUTHOR

Sudarshan Chemical Heading for 720-760+Sudarshan Chemical setting up nicely, keep on radar for short to med-term. Looks like It's Heading for 720-760+
Consult your financial advisor before investing...

$VLDRVelodyne Lidar, Inc. provides real-time three-dimensional vision for autonomous systems worldwide. Its sensor and software solutions provide flexibility, quality, and performance to meet the needs of a range of industries, including autonomous vehicles, advanced driver assistance systems, robotics, unmanned aerial vehicles, and smart cities and security. The company also provides Vella software, a data curation software platform designed to deliver a set of safety and autonomy applications to any vehicle that utilizes a Velarray lidar. Velodyne Lidar, Inc. was founded in 1983 and is headquartered in San Jose, California.

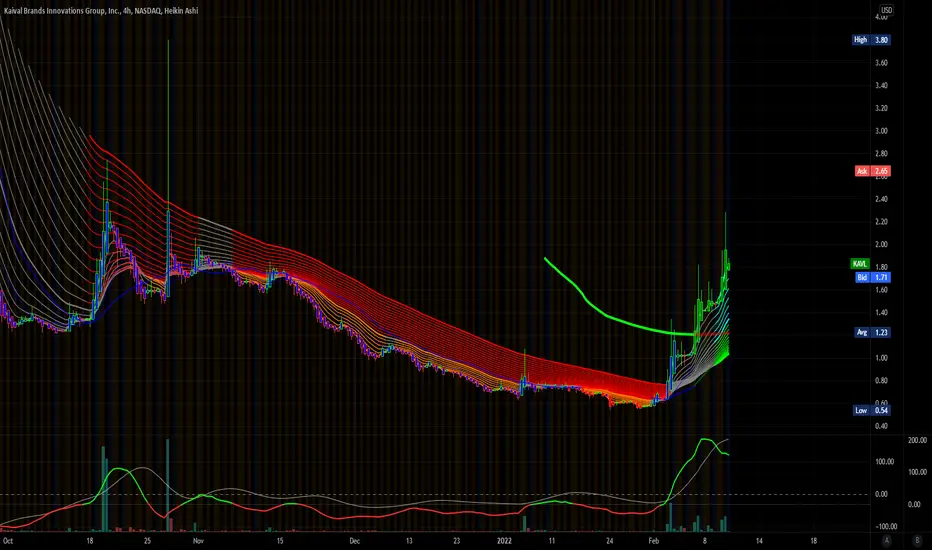
$KAVLKaival Brands Innovations Group, Inc. distributes electronic nicotine delivery systems (ENDS Products) and related components in the Unites States. The company offers Bidi Stick, a disposable and tamper-resistant ENDS Product in various flavor options; and Bidi Pouch, a tobacco-free nicotine formulation, which contains natural fibers and a chew-base filler in different flavors. It sells its products to retail and non-retail customers through website bidivapor.com. The company was formerly known as Quick Start Holdings, Inc. and changed its name to Kaival Brands Innovations Group, Inc. in July 2019. The company is based in Grant-Valkaria, Florida. Kaival Brands Innovations Group, Inc. is a subsidiary of Kaival Holdings, LLC.
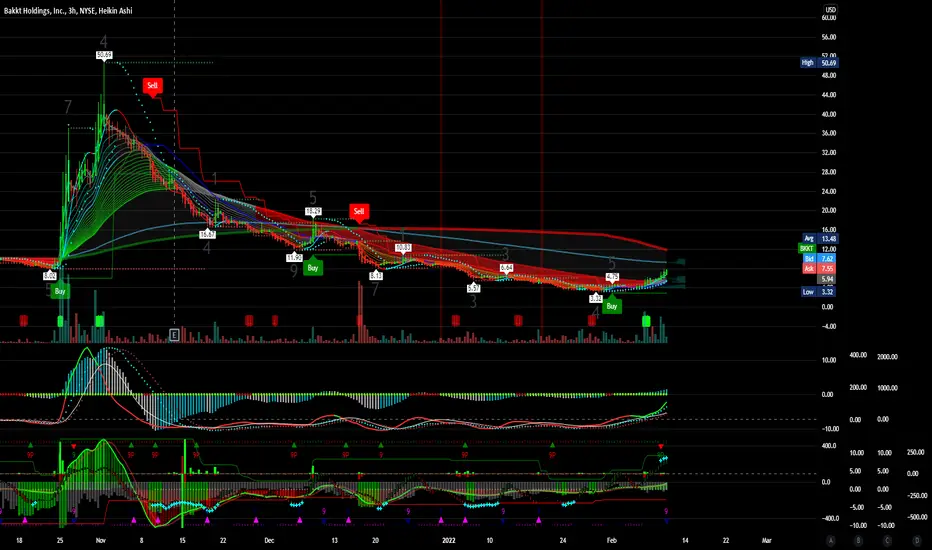
$BKKT Bakkt Holdings, Inc. operates a digital asset platform. Its platform enables consumers to buy, sell, store, and spend digital assets. The company was founded in 2018 and is headquartered in Atlanta, Georgia. Bakkt Holdings, Inc. is a subsidiary of Intercontinental Exchange Holdings, Inc.
GBP/USD Buy LimitNice Area to look at potential long positions. Used the Fibonacci from different view points and ends up around here so alerts have been place to see where we can go.

GoldViewFX - 4H Market UPDATE & TARGET$$Hey All,
Our 4h chart setup had the EMA5 cross and candle body close above 1826 to open and confirm 1836 and 1840.
This was a clean 70 pips up so far, close to 1836 point to point. Target is still short by a few pips so 1836 still open and 1840.
If we see a failure to cross 1836 with EMA5 even whiteout a candle body close, we can potentially see price reject to as low as 1814 for support. We will continue to update any changes to our plans.
Please don't forget to like the post, it keeps us motivated to bring you more FREE content.
GoldViewFX
XAUUSD TOP AUTHOR

GoldViewFX - Market UPDATE and TARGET$$Hey All,
I know you keep hearing me say this....but here it goes....Another amazing day of trading for us. Those following we called 1834 as a target confirmed with EMA5 cross and lock. This target was HIT perfectly.
1839 is the next TARGET. We have identified a potential retracement range of 1828 and the swing range has also moved up in the setup. We remain Bullish and continue to buy dips.
Stay tuned for more updates and please don't forget to LIKE, COMMENT and FOLLOW to support us.
GoldViewFX
XAUUSD TOP AUTHOR

MASK/USDT buy set upHELLO FRIENDS, this is my buy set up in MASK/USDT... Hope you will follow the same. FOLLOW FOR MORE

GoldViewFX - 4H & DAILY MARKET UPDATEHell All,
Okay so we have hit the 1826 target perfectly on our 4h chart idea. We will now wait to see how EMA5 challenged this level. This level has been tested twice before and a EMA5 failure to cross had price rejected back to 1814 and below. We need to taker caution in adding long without further confirmation.
If ema5 crosses 1826 with candle body close, we should see price leave RANGEBOX 2 and target the entrance of RANGEBOX 1 at 1836.
This could be an area to short but we will wait for confirmation before making a move.
DAILY CHART
Once again 1827 target was hit on the daily chart idea posted today. This level is strong resistance on the daily chart in line with the H4 chart. It has failed 4 x previously. However the Bullish structure is still supported by the daily chart Goldturn trendline, which may give the support needed to break through. We will keep you posted throughout the week so stay tuned.
Please don't forget to like, comment and follow to support us.
GoldViewFX
XAUUSD TOP AUTHOR

GoldViewFX - 1H Market UPDATE & TARGET$$Hey All,
What a smashing couple of days. Those following us can clearly see the targets we identified (see related posts below) all HIT perfectly. 1816, 1824, 1828 H1 CHART targets done.
What can we expect now?
Although our last target of 1828 has been hit that does not mean 1834 is now open. We would like to see EMA5 cross above 1828 with candle body close to open target for 1834. We will keep you all posted when we see the confirmation. For now we remain Bullish and, as confirmed throughout, we will be buying dips. If EMA5 fails to cross and lock above this level, then we will see some retracement again towards 1816 otherwise we have another clean run up towards the upper targets.
Please note the swing range in taking buys in this range, it helps me manage my risk.
We will be posting updates, levels and targets on H4 and D1 charts shortly so stay tuned.
Please don't forget to like the post, we really appreciate it.
GoldViewFX
XAUUSD TOP AUTHOR

GoldViewFX - Market UPDATEHey All,
This is a follow up from yesterdays update. We caught some action from the bottom buying dips and took partials. We thought we would update the daily chart for you all, which also supports all our analysis.
We can see already historically in the past 8 months, every time 1818 had a candle close above it, price would always follow through and as a minimum hit 1827, which is the lowest of the range it would do. We tried to illustrate this, as best, as possible on the chart. We have also marked the potential swing range (potential reversal) to manage our risk.
A break below the swing range will open the lower targets. Should this happen we will update plans accordingly and share.
Please don't forget to like, comment and follow to support our work.
GoldViewFX
XAUUSD TOP AUTHOR

GoldViewFX - Update on TARGETS$Hey All,
Quick update on our TARGET - 1816. - BOOOOOM. What can we say once again we called it and we called it one way (see related post below). We banked at 1816, which was identified with a EMA5 cross and candle body close leaving a gap to Target.
We will now wait and sit back to see how EMA5 challenges 1816. If we see a cross with a candle body close above 1816, it will confirm 1824 and 1828. Although we also have long range targets above together with the Bullish structure we have identified, therefore we remain Bullish and continue our plans to Buy dips from good support levels.
We will post an update with analysis this evening to gear up for the morning.
Please don't forget to Like, Comment and Follow to support us, we really appreciate it.
GoldViewFX
XAUUSD TOP AUTHOR

Nifty Bank Buy Long Setup As You Can see There's a Strong Demand Zone, Waiting for price drop to that level and then we can execute a order after see some confirmation such like Bullish Engulfing etc. If price broke that Demand zone then we have to pay attention for retesting that area, then we can setup a Short Position. You can Share your thoughts on this topic.
Thanks! HAVE A GOOD TRADING FUTURE
