GoldViewFX - 3H CHART UPDATE & TARGETS$Another awesome day of trading for TEAM GOLDVIEW!!
1806 Goldturn axis was hit, as per our post on the 16th December (see related post below). We identified this as a target and a strong level of support. Price was rejected at 1806 and failed to break down so we saw a retest back to 1820 level. Our buy entries from 1806 were all banked at 1819 and now we see price hover in between.
Its interesting to see, resistance levels like 1806 are now turning into strong support levels. This is a key example of the Bullish structure that gives us confidence to buy dips.
We will now wait to see 1806 break to confirm movement to the lower levels and if so we will change up our plans and update you all accordingly. There is room for price to challenge the lower part of the channel, however MA200 is also providing support here and this can give the momentum needed for a challenge back to 1817 and then 1825.
A bull flag formation is also inline with the upper part of the channel flagpole target at 1850.
All signals we took have TP'd and we are proud to say with a 100% hit rate for January. (See related post below on H1 targets)
Please dont forget to like, comment and follow to support us.
GoldViewFX
XAUUSD TOP AUTHOR
Buysetup

GoldViewFX - H1 UPDATE and TARGET$This was posted yesterday and the levels are playing out. Price moved up during Tokyo market open and found resistance again at 1823 Goldturn, followed with movement down.
EMA5 has now crossed below 1817 with a candle body close, confirming further movement down and a gap to 1806, however price found support at 1810, which is a historical Goldurn from December, which we have highlighted now.
Our setups remain same until we see a break below 1795 with EMA lock and confirmation.
Please dont forget to like, comment and follow, we appreciate it.
GoldViewFX
XAUUSD TOP AUTHOR

GoldViewFX - H1 Update and Targets$Quick update on yesterdays post on the HOURLY CHART (see link to related post below).
We identified a range of 1817.42 - 1828.99 and expecting price to play in this range.
EMA5 broke 1817.42 down with a candle body close, which opened up the lower levels. 1806 being the strong Goldturn level, however price went and HIT the recent 1814 Goldturn and found support. Anyone who noticed this break, which we highlighted could have caught 30pips here.
The price then broke back up into 1817 Goldturn with a candle body close, which opened the upper levels, 1828 being the strong Goldturn, however price went and HIT the recent 1823 Goldturn and found some resistance; another easy catch, if anyone caught it to the next Goldturn. We had a buy signal activate here, confirmed with all our parameters, which we took and banked!!!
We have also identified a Bull flag formation here and the potential target of the pole is inline with our overall 1828 Target. We continue to buy dips and should this change, we will be sure to update you all.
Please don't forget to like, comment and follow, we really appreciate it.
GoldViewFX
XAUUSD TOP AUTHOR

AUDCAD Bulls will take over, LONG!AUDCAD has been in a downtrend for a while sellers are now exhausted because we can see the decrease in volume. price is now ranging in a bearish flag and we can anticipate a break to the upside. In this week I will be monitoring this pair for a buying opportunity around 0.925 level.

GoldViewFX - 4H chart SETUP and LEVELSQuick update on our 4H chart setup.
Its pretty self explanatory with strong resistance and support Goldturns updated.
We expected some push up to challenge 1802, which got done. We are now expecting price to challenge the outside of the channel in line with 1815 axis point. We are expecting a retracement from this level, However news events or bullish momentum may allow price to break back into the Goldturn channel.
We will keep you posted of any changes and updates.
Please don't forget to HIT LIKE!!!
GoldViewFX
XAUUSD TOP AUTHIR

xauusdDepending on the correction mode, one can expect oscillation in a triangular channel
Re-testing the canal floor is not far off But due to the waves formed, this will not happen soon.
I expect an upward movement But this move will not be long.
Positive and negative news will confirm this price suffering.
You can wait if the pattern is formed to enter the purchase in the invalid cast doubt phase (a.b.c)

USDCAD Potential Bullish Reversal, LONG!USD has been in a downtrend for a while now it seems that the bears are exhausted and price is breaking lower Tf structures to the upside. In the upcoming week i will looking for a buying opportunity around 1.249 demand zone.
If you don't understand the structure do not trade.

Reviewing my last trade for 2021: $TRT 25%ish gainLuckily, I ended up 2021 with a win. It was a modest one but given how tough the trading environment was back in December for the long side (likewise in the start of 2022), I'm thankful that I was able to pull off a W. Let's review it
$TRT is the ticker of the trade.
First entered the trade back in December 7, 2021 (1st Green Arrow) at $9, when it proved strength. Cut was $7.20
Was a little challenged by this trade given it didn't move right away as I expected it to. When it retraced, I gave myself two options: follow the original cut or exit the position early and buy it back in case stock proves me wrong. Decided to go for the latter and went out of the position last Dec 13, 2021. (1st Red Arrow)
I was proven wrong. I went back in TRT on Dec 15 (2nd Green Arrow), again when it showed strength and added more when it slightly corrected (Multiple Green Arrows). Me being proven wrong by the stock earlier gave me more confidence to size this bigger compared to the initial engagement.
Used the 5 Day Moving Average to trail my profit when I was ahead. Was initially targeting $15 but it never happened. TRT retraced to my trail profit, putting me out of the trade at $11.40 with a 25% gain (2nd Red Arrow). Expected more but can't complain. A nice end of year bonus.
Takeaways from this trade: Always be ready and be patient for your A+ setups to manifest.
Zooming out, the area pattern traded is an ascending triangle, a bullish area pattern
Hope you learned a thing or two.
Thanks and good luck out there!

Buy TINPLATEHigh Probability Trade
Timeframe Used:
Weekly
Trade Frame:
Few Weeks/Months
Why Buy ?
-> Simple Price Action, Price making HH-HL.
-> After reaching ATH, price retraced from 50% Fib levels and has given a nice breakout with Volumes
-> Nice CUP breakout on longer TF
For Swing:
Buy Above: 325
Stop Loss: 280
(Weekly Closing Basis)
Targets: 345, 375, 400 ++
Trail your SL above 350
For Midterm:
Buy Above: 325
Stop Loss: 250
Add More around 300 levels, add at every dip till 280
Ride this stock for long !!

$RHI to head higher after breaking out of a tight 3week range?* Great earnings
* Very strong up trend
* High 3-month relative strength of 1.41 in the Healthcare sector
* High U/D volume ratio of 1.51
* Breaking out of a very tight 3 week consolidation of ~3.85% with higher than average volume
* If you have access to Volume Profiles you can see that the $113.04 area has tonnes of volume.
* We can expect the $113.04 area to serve as support moving forward.
Trade Idea:
* Looking at the weekly, this seems like a great time to enter as it's recovering from the pull back.
* If you are looking for a better entry you can wait for an opportunity around the $113 area as that should serve as support moving forward.

TER will it continue to the up side?* Exceptional earnings
* Very strong up trend in the long term
* Very high 3-month relative strength of 6.35 in the Tech sector
* Pays out dividends
* I last discussed this early December 2021 when it broke out of an 11 month base.
* Since then it did move higher and due to recent market conditions it had a slight pull back.
* Used $163.03 as support before breaking below.
* Now it's breaking out of the pull back zone and showing signs of going higher.
Trade Idea:
* Given the market uncertainty you can wait to see how it behaves next week.
* You can enter at today's close
* Or if you're looking for a slightly better entry you can look for an opportunity near the $163.03 area.
* If you have access to Volume Profiles you can see that the $163 area did receive quite a bit of volume so I would expect it to serve as support moving forward.

GoldViewFX - UPDATE on TARGETS$$This was posted on the 12th of JAN. We called both targets top and bottom.
We identified a broken Goldturn 1823 with EMA5 crossing with candle body close and leaving a gap confirming a move to 1828. This played out perfectly!!
1828 was an area that has been rejected before more than once therefore the level has strengthened as resistance. We highlighted that should EMA5 fail to cross this with candle body close we will get the rejection to 1817. This played out perfectly too!
The Goldturn range is now 1817 to 1828. Price is now challenging 1817. We will look to see if EMA5 crosses this level to open up the lower levels. If we see a Goldturn created above 1817, then we can expect the price to go back to challenge the upper levels again.
We remain confident in our setups and will continue to share updates and ANY changes to our plans.
We have had another smashing week and now wish you all a great weekend. We will be sure to share our analysis for the coming week Sunday night, so don't forget to check in.
Please don't forget to like, comment and follow, it helps us to bring more updates to you, so keep supporting us!!
GoldViewFX
XAUUSD TOP AUTHOR

GoldViewFX - Daily Chart ProjectionSo far we have had an awesome week and our setups for the current market are performing perfectly.
Our plans to buy dips still remain and we are looking for price to target 1834. We are trading each level on the shorter time frames in stages but wanted to share the Daily chart view for an overall plan.
Should the price get rejected here, we will still remain bullish unless we see a break on the trendline at 1795 with EMA5. If this trendline breaks with EMA5 then we will slow down and lighten load on buying dips.
Should this trendline stay respected, we should get a breakout into 1834 and 1852 with plenty of retracements for entries.
We wait patiently and cherry pick where we need to.
Please don't forget to like, comment and follow to support us. It helps us, to bring more updates to you!
GoldViewFX
XAUUSD TOP AUTHOR


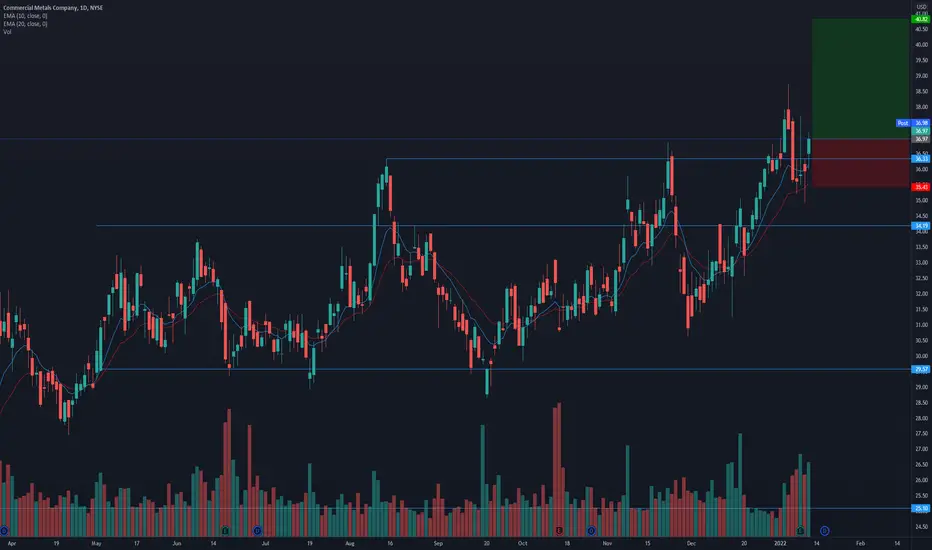
$CMC breaking out of a ~7 month base!* Great earnings
* Strong up trend in the long term
* High 3-month relative strength of 1.08 in the Basic Materials sector
* Pays out dividends
* Breaking out of a ~7 month base with higher than average volume
* Broke out earlier but due to current market conditions it did have a slight pull back and now is breaking out once again.
* It did, in the recent months, break out of a multi-year base
Trade Idea:
* You can look to enter at today's closing price.
* If you want a better entry you can look for an opportunity around the $36.33 area
WY breaking out of an 8 month base!* Great earnings
* Very strong up trend in the long term
* High 3-month relative strength of 1.12 in the Real Estate sector
* Pays out dividends
* Breaking out of a ~8 month cup formation with a depth of ~25.94%
* Attempted to break out a couple of weeks ago but due to current market conditions it had a slight pull back and now is breaking out once again.
* Maximum probable ROI is ~25.94%
Trade Idea:
* You can enter now at today's close if you want to stay in the market.
* Due to uncertain conditions it's better to enter with a small position if not in cash.
* If you're looking for a better entry, you can look for an opportunity around the $40.54 area.

KLAC ready to make new all time highs?* Exceptional earnings quarter over quarter
* Incredibly strong up trend over the long term
* High 3-month relative strength of 2.87 in the Tech sector
* Pays out dividends
* Breaking out of a base on base pattern
* First base lasted ~8 months before breaking out
* Second base formed immediately after the breakout and has been forming for the past ~9 weeks
* Current week is also forming a bullish engulfing candle
* It did try and break out of the second base earlier but due to current market conditions it had a slight pull back.
* Now it's breaking out for the second time with higher than average volume.
Trade Idea:
* You can enter now at today's close as a starter position if you want to stay in the market and set a closer target.

GoldViewFX 1H level update and TARGET$Quick update on the 1H chart setup.
We have 1823 Goldturn broken with EMA5 and candle body close confirming next stop to 1828.
1828 is a strong Goldturn level - if this fails to break with EMA5 then we expect retracement down to 1817 Goldturn.
If 1828 breaks open with EMA5 and candle body close then al the upper levels open up. We are still very much buying dips. Any changes to this plan we will continue to keep you all updated.
Please don't forget to like, comment and follow to support us.
GoldViewFX
XAUUSD TOP AUTHOR

Buy signal from many indicatorsOrigin protocol token $OGN is a very volatile coin.
It has a lot of interest in last days as shown by the Big Guy indicator.
Also, it holded the long time support zone of 0.45-0.46.
SL under 0.44 (to allow possible squizes)
Targets 1.2 - 1.4

LITE breaking out of a tight range with higher than average volu* Excellent earnings
* Strong up trend in the long term
* High 3-month relative strength of 2.61 in the Tech sector
* High 50 day U/D ratio of 2.11
* Breaking out of a 3.31% range
* During the consolidation the volume did dry up and as it started breaking out the volume picked up.
Trade Idea:
* You can enter now as the price is just breaking out of the tight range
* If you're looking for a better entry you may wait for an entry opportunity near the $105.61 area

$SBEV Target PTs 2-2.50-6-9 and higherSplash Beverage Group Receives Authorization for TapouT in Walmart Stores Across Florida Metropolitan Areas
Fort Lauderdale, Florida, Jan. 11, 2022 (GLOBE NEWSWIRE) -- Splash Beverage Group, Inc. (NYSE American: SBEV) ("Splash" or the "Company"), a portfolio company of leading beverage brands, today announced it has received authorization to sell its TapouT performance drink in Florida beginning with 47 Walmart stores located in major metropolitan regions. Walmart has approximately 341 stores in the state of Florida, the second largest number of stores by state in the U.S.
“We are thrilled with this Walmart authorization, and this is a wonderful way to start 2022. Walmart is extremely selective in the brands they choose to offer their shoppers and selecting TapouT is great validation that TapouT can compete at the highest level with the biggest global brands,” said Robert Nistico, Splash Beverage Group’s Chairman and CEO. “We are grateful to Walmart for the opportunity, and equally grateful to our distribution partner AB One and the Anheuser Busch network, who’s credibility with Walmart we are certain played an important role in our selection. The opportunity for significant growth within the Walmart Florida market and beyond is one that we will eagerly seize, and we appreciate the validation and confidence Walmart has demonstrated with us and the TapouT brand".
Follow Splash Beverage Group on Twitter: www.twitter.com
About Splash Beverage Group, Inc.
Splash Beverage Group, an innovator in the beverage industry, owns a growing portfolio of alcoholic and non-alcoholic beverage brands including Copa di Vino wine by the glass, SALT flavored tequilas, Pulpoloco sangria, and TapouT performance hydration and recovery drink. Splash’s strategy is to rapidly develop early stage brands already in its portfolio as well as acquire and then accelerate brands that have high visibility or are innovators in their categories. Led by a management team that has built and managed some of the top brands in the beverage industry and led sales from product launch into the billions, Splash is rapidly expanding its brand portfolio and global distribution.

$KPRX Target PT 2 and higherKiora Pharmaceuticals to Provide 2022 Business Outlook at the H.C. Wainwright Bioconnect Virtual Conference
Salt Lake City, Utah--(Newsfile Corp. - January 5, 2022) - Kiora Pharmaceuticals, Inc. (NASDAQ: KPRX) will participate in the H.C. Wainwright Bioconnect Virtual Conference January 10-13, 2022. Brian Strem, Ph.D., President and Chief Executive Officer, will provide an outlook for the business and its pipeline of treatments for ophthalmic diseases.
The corporate presentation will be available on-demand and accessible from the Company's Investor Relations website starting Monday January 10, 2022 at 7:00 am Eastern Time.
About Kiora
Kiora is a clinical-stage biotechnology company developing and commercializing products for treating ophthalmic diseases. KIO-301 is a molecular photoswitch that has the potential to restore light perception in patients with inherited and/or age-related retinal degeneration. KIO-101 is a next-generation, non-steroidal, immuno-modulatory and small molecule inhibitor of Dihydroorotate Dehydrogenase ("DHODH") with best-in-class picomolar potency and a validated immune modulating mechanism (blocks T cell proliferation and proinflammatory cytokine release) designed to overcome the off-target side effects and safety issues associated with other DHODH inhibitors. In addition, Kiora is developing KIO-201, a modified form of the natural polymer hyaluronic acid, designed to accelerate corneal wound healing. For more information, please visit www.kiorapharma.com.
Forward-Looking Statements
Some of the statements in this press release are "forward-looking" and are made pursuant to the safe harbor provision of the Private Securities Litigation Reform Act of 1995. These "forward-looking" statements include statements relating to, among other things, the development and commercialization efforts and other regulatory or marketing approval efforts pertaining to Kiora's products, including KIO-101, KIO-201 and KIO-301, as well as the success thereof, with such approvals or success may not be obtained or achieved on a timely basis or at all. These statements involve risks and uncertainties that may cause results to differ materially from the statements set forth in this press release, including, among other things, market and other conditions and certain risk factors described under the heading "Risk Factors" contained in Kiora's Annual Report on Form 10-K filed with the SEC on March 25, 2021 or described in Kiora's other public filings. Kiora's results may also be affected by factors of which Kiora is not currently aware. The forward-looking statements in this press release speak only as of the date of this press release. Kiora expressly disclaims any obligation or undertaking to release publicly any updates or revisions to such statements to reflect any change in its expectations with regard thereto or any changes in the events, conditions, or circumstances on which any such statement is based, except as required by law.

QCOM offering a Pocket Pivot entry in a base on base setup!* Excellent earnings
* Very strong up trend
* High 3-month relative strength of 4.43 in the Tech sector
* Broke out of a 1 year base with tonnes of volume on earnings
* Started to consolidate after the breakout in a tight 7-8 week range
* Has a U/D ratio of 2.11, indicating that it's under accumulation
Trade Idea:
* You can enter on the closing price today as a pocket pivot signal.
* If you're looking for a better entry you can wait for an opportunity near the $183.04 area
* You can look to add to the position if the price makes a daily close above $191.30
Caution:
* This is a pocket pivot signal and though there's little to no overhead resistance, the stock may not break out of the range immediately.

GoldViewFX updated LEVELS and TARGETS$$We had a great start to the week and our analysis played out perfectly!!
Price supported well at the bottom of this Goldturn channel and now heading towards the top end of the channel 1826 and above. There are some strong Goldturn resistance levels on the way up, however we will be observing how EMA5 crosses these levels to secure the next level.
GOLDTURN RESISTANCE
1826
1833
1846
GOLDTURN SUPPORT
1820
1814
1805
1800
1795
1788
We are looking for some retracement down to 1805 and need this area to be supported, as the support levels are rising and helping price find support earlier, each time we climb up this Goldturn channel. Our followers will notice we draw our channels using Goldturns and not many do this. Its been very unique to us and the results speak for themselves.
Please don't forget to like, comment and follow to support us.
GoldViewFX
XAUUSD TOP AUTHOR
