ZIM ready to go higher?* Relatively new company
* 3 out of 4 earning reports were great
* Strong up trend
* High 3-month relative strength in the Industrial sector
* Pays dividends very generously
* Increase in institutional interest
* Breaking out of a 15 week base forming a cup and handle pattern
* Depth of the cup is ~24.8%
* Breaking out with higher than the 15 day average volume
* $57.54 should serve as support moving forward
Trade Idea:
* Now's a great time to enter as the markets seem to be recovering and the sector seems to be doing well also.
* The price is very close to the broken level
Buysetup

ODFL offering another great entry before the next leg higher!* Great earnings
* Very strong up trend
* High 3-month relative strength in the Industrial sector
* I last mentioned ODFL when it was about to break out from $304.22 and it has since then moved higher.
* Even as the industrial sector was hit hard in the past week ODFL managed to consolidate maintaining its volume.
* This indicates that institutions are very interested in this stock.
* If the market is rebounding now, we can expect ODFL to continue higher.
Trade Idea:
* Now's a great time to enter as it's bouncing off of support but hasn't moved too far up.
* If you're looking for a slight discount you may look for an entry near the $349.21 area.

GBPJPY LONG TRADE IDEA!I have entered long trades on gbpjpy as its back into that buy area for me, stops will be moved if we can make a quick upside push.

UPDATE on gold targets. 2 done! 1 to go!! $$Our second target at 1786 is now done. We had the support target at 1774 done earlier and expected this to be supported for now, which played our perfectly. Now 3rd target at 1796 is due. We will review this and update with any changes and how we manage any changes.
Please dont forget to hit like, comment and follow to see more updates on how we manage the movement in the Gold market.
GoldViewFX
XAUUSD TOP AUTHORS

UPDATE on gold targets. 1 done! 2 to go!! $$Quick update on the outstanding intra day targets. 1774 done! now looking for support and then 1786 and 1796 due.
We will update any changes, as the price plays out.
Please don't forget to like, comment and follow to support us, we really appreciate it!
GoldViewFX
XAUUSD TOP AUTHOR

BNB/USDT ( PERP ) LONG RUN Going Long at 578.00
Target 720.00
As the dump of bitcoin pull all the altcoins down now we are looking at a bullish wave so fingers-crossed..!

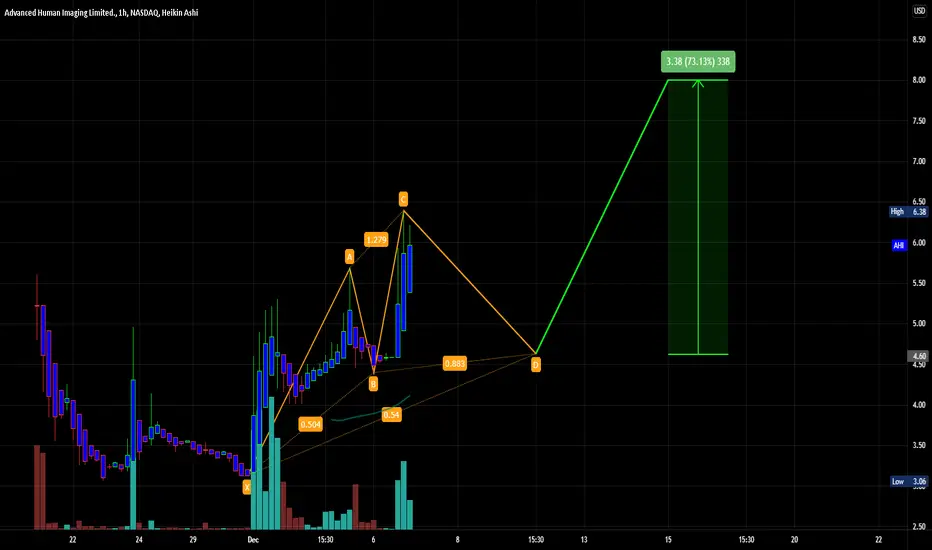
$AHIAdvanced Human Imaging shares are trading higher as traders circulate a press release from the company titled 'Advanced Human Imaging concludes Definitive agreements with Canadian based Cubert.'
Advanced Human Imaging Limited operates as a mobile application and technology development company worldwide. It develops and patents a proprietary measurement/dimensioning technology that enables end-user to check, track, and assess body dimensions privately using a smartphone. The company offers smartphone-based human scanning technology, such as BodyScan, FaceScan, DermaScan, MKScan, and HemaScan. It serves mobile health and telehealth, life and health insurance, fitness and wellness, and consumer apparel sectors. The company was formerly known as MyFiziq Limited and changed its name to Advanced Human Imaging Limited in March 2021. Advanced Human Imaging Limited was incorporated in 2014 and is based in South Perth, Australia.
GBPJPY LONG TRADE UPDATES Exactly as I explained we got another rejection from the buy zone so hopefully some of you guys got entry's, from there we have now seen price push higher breaking the last lower high to confirm we should see a further push to the upside.. id expect to see a bit of a resistance at 151.500 from there hopefully we can get a pull back for another buy opportunity

$GGPI Gores Guggenheim, Inc. intends to acquire assets and businesses through a merger, capital stock exchange, stock purchase, reorganization, or similar business combination. The company was founded in 2020 and is based in Boulder, Colorado.

$SONX Parallel channelB of A Securities Initiates Coverage On Sonendo with Buy Rating, Announces Price Target of $15
Sonendo, Inc., a commercial-stage medical technology company, develops, manufactures, and commercializes devices for root canal therapy in the United States and Canada. It provides GentleWave, a tooth decay treatment device for cleaning and disinfecting the microscopic spaces within teeth without the need to remove tooth structure. The company also offers SoundSeal, a material used to build and create a sealing platform on the top of the crown; and Sonendo-branded liquid solution of ethylenediaminetetraacetic acid that is used to help debride and disinfect the root canal system. In addition, it provides The Digital Office, a practice management software that integrates digital office for dental practitioners. The company was formerly known as Dentatek Corporation and changed its name to Sonendo, Inc. in March 2011. Sonendo, Inc. was incorporated in 2006 and is headquartered in Laguna Hills, California.

1710 long term gold target identified This is a quick update on a new level that we have identified in our setup. We have been buying dips and still targeting longs from good support levels.
However we have just identified a Goldturn AXIS level at 1710, which is likely to hit at some point before some of our long term Bull targets. 1819 is still looking like a level that would be taken out before this axis level. However now that we have this target activated we must take caution in managing our long positions and make sure we are able to manage any exposure at that range.
Please also review our overall report and analysis on the link to related ideas below;
Please dont forget to hit like, comment and follow to support us.
GoldViewFX
XAUUSD Top Author

Avalanche Key Level To HoldWelcome to this analysis about AVAVLANCHE and the weekly timeframe perspectives.
AVAX is currently holding 80$ as supports on weekly time frame. But due to recent sell off in BITCOIN AVAX lost 1.272. I think we might another leg down Between 60-70$ zone.

BTC Price PathHello Traders,
Today with this support and resistance area, Price may go up like path.
But It's too much time for higher prices.
Hope to Buy at good moments and have profit days.
Like and share your Idea in the comment!

GBPJPY TREND CHANGE BUYOn the higher time frame, you see gbpjpy hits resistance, to finally turning, the first week of december and we have more than three confirmations, are YALL READY?

EURUSD replay trades hey traders. just did a video on how EU went last week and some setups that came into play.

EURUSD buy trades Still looking for an upside move as price is starting to shape nicely. The area of 1.12600 is where I'm looking to see more rejection for confirmation of those buy trades. Hopefully this week we get some momentum and can catch nice buy trades, as always make sure risk is on point and your are sticking to your plan!
