BUY NASDAQ finally !!!strong signal to buy NASDAQ, If you liked this idea, don’t forget to put a like.
Buysignal

USDCHF Fibonacci BuyThe area between 0.9580 and 0.9569 features three levels that may pan out to be robust support:
Support(1): Daily EMA, 0.9580
Support(2): Daily 38% Retracement, 0.9569
Support(3): Weekly 38% Retracement, 0.9569
Here's the trade:
1) Buy 0.9580
2) Initial stop loss @ 0.9544
3) TP @ 0.9616
4) Risk/Reward, 1:1
The coming 16 hours feature the ECB Minutes, US Q2 GDP, US Core PCE, and kickoff of the Jackson Hole Symposium. Be ready for anything as these reports hit newswires.

LongHe mine fellow traders another buying opportunity on
AU
confluence
1. inverted Head and shoulder pattern
2. Break of structure
Im waiting for price to close above my EMA lines ...
Share and Comment ...

Gold - Buy OpportunityGold has broken out of its downward channel on the daily timeframe and has retested. It is a good time to look for buy entries which can be held until the 1855-1865 area.

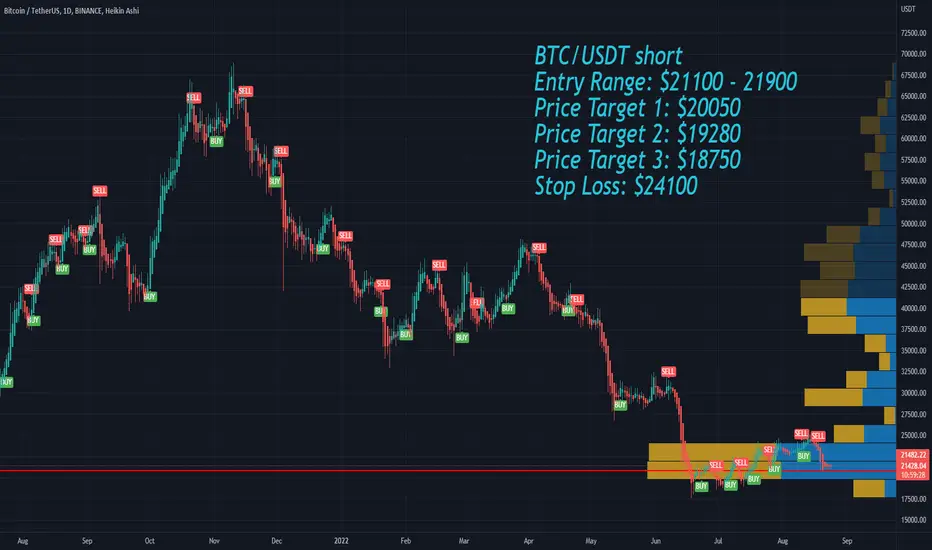
Bitcoin BTC short Entry Range, Take Profit and Stop LossBTC/USDT short
Entry Range: $21100 - 21900
Price Target 1: $20050
Price Target 2: $19280
Price Target 3: $18750
Stop Loss: $24100
Is $ARCB ready to start coming up on the right side of its base?Notes:
* Very strong up trend since March 2020 on all time frames
* Great consistent earnings since 2020
* Basing for the past ~9 months now
* Broke above and retested $86.7 which has acted as a pivotal area for bulls and bears
* Consolidating just above $86.7 for the past ~4 weeks with decreasing volume
* It was consolidating around the bottom of its base with decreasing volume as well; meaning sellers lost steam
Technicals:
Sector: Industrials - Trucking
Relative Strength vs. Sector: 4.04
Relative Strength vs. SP500: 5.53
U/D Ratio: 1.32
Base Depth: 86.73%
Distance from breakout buy point: -28.74%
Volume 1.77% above its 15 day avg.
Trade Idea:
* You can enter this now as the price is close to its 50 day line and it's also close to the broken resistance of $86.7
* If you're looking for a better entry you can try catch one around $86.7 as that should hold as support moving forward
* This stock usually has local tops when the price closes around 27.14% above its 50 EMA
* Consider selling into strength if the price closes 26.94% to 27.34% (or higher) above its 50 EMA
* The last closing price is 7.21% away from its 50 EMA

$TBLT Next Target PTs 9-13 and higherToughBuilt Industries, Inc. designs, develops, manufactures, and distributes home improvement and construction products for the building industry in the United States and internationally. It offers tool pouches, tool rigs, tool belts and accessories, tools bags, totes, various storage solutions, and office organizers/bags for laptop/tablet/cellphones, etc.; and kneepads. The company also provides sawhorses, miter saws, table saws, roller stands, and workbenches; sawhorse/jobsite tables; and digital measure and levels. It offers its products under the TOUGHBUILT brand through various home improvement big box stores, professional outlets, and direct marketing to construction companies and trade/wholesale outlets. The company was formerly known as Phalanx, Inc. and changed its name to ToughBuilt Industries, Inc. in December 2015. ToughBuilt Industries, Inc. was incorporated in 2012 and is based in Lake Forest, California.

$GRNQ Next Target PT 7 and higherGreenpro Capital Corp. provides financial consulting and corporate services to small and medium-size businesses primarily in Hong Kong, Malaysia, and China. It operates in two segments, Service Business and Real Estate Business. The company offers business consulting and corporate advisory services, including cross-border listing advisory, tax planning, bookkeeping, advisory and transaction, record management, and accounting outsourcing services; and venture capital related education and support services. It is also involved in the acquisition and rental of real estate properties held for investment and sale; and provision of company formation advisory, company secretarial, and financial services. In addition, the company provides corporate advisory services, such as company review, bank loan advisory, and bank products analysis, as well as loan and credit, and insurance brokerage services; and wealth planning, administration, charity, tax and legal, trusteeship and risk management, investment planning and management, and business support services, as well as asset protection and management, consolidation, and performance monitoring services. The company was formerly known as Greenpro, Inc. and changed its name to Greenpro Capital Corp. in May 2015. Greenpro Capital Corp. was incorporated in 2013 and is headquartered in Kuala Lumpur, Malaysia.

$HSDT Next Target PTs 2.25-2.75 and higherHelius Medical Technologies, Inc., a neurotechnology company, focuses on developing, licensing, and acquiring non-invasive technologies for the treatment of symptoms caused by neurological disease or trauma. Its product, Portable Neuromodulation Stimulator (PoNS), is a non-surgical medical device intended for use as a short term treatment of gait deficit due to symptoms from multiple sclerosis and balance deficit due to mild-to-moderate traumatic brain injury, as well as to be used in conjunction with supervised therapeutic exercise. The company is headquartered in Newtown, Pennsylvania.

SNOW Snowflake Options Ahead Of EarningsIf you haven`t shorted SNOW when i wrote this article:
Then Looking at the SNOW Snowflake options chain, i would buy the $185 strike price Calls with
2022-11-18 expiration date for about
$9.10 premium.
Looking forward to read your opinion about it.

$CAL is breaking out of a ~15 month long base. Can it go higher?Notes:
* Strong up trend since March 2020
* Good earnings in the recent quarters
* Basing for the past ~15 months
* Broke out around the end of May but pulled back to its 200 day line
* Currently breaking out of historical resistance of $29.85 with higher than average volume
* Next historical resistance comes in around $31.38
Technicals:
Sector: Consumer Cyclical - Footwear & Accessories
Relative Strength vs. Sector: 1.8
Relative Strength vs. SP500: 5.0
U/D Ratio: 1.44
Base Depth: 67.62%
Distance from breakout buy point: 1.31%
Volume 11.71% above its 15 day avg .
Trade Idea:
* You can enter now as the price is just breaking out of its base and historical resistance with higher than average volume
* If you're looking for a better entry you can look for one around the $29.85 area as that should hold as support moving forward
* This stock usually has local tops when the price closes around 21.29% above its 50 EMA
* Consider selling into strength if the price closes 21.09% to 21.49% (or higher) above its 50 EMA
* The last closing price is 11.01% away from its 50 EMA

EURCHF BUYI suspect that the EURCHF pair will experience a bullish sentiment up to the price of 0.96200.

$EQNR is breaking out of its base with a Pocket Pivot!Notes:
* Very strong up trend on all time frames
* Good earnings in the recent quarters
* Created a double bottom base for ~5 months and is now breaking out with higher than average volume
* Not much else to say... it's a great looking chart ;)
Technicals:
Sector: Energy - Oil & Gas Integrated
Relative Strength vs. Sector: 6.09
Relative Strength vs. SP500: 1.64
U/D Ratio: 1.17
Base Depth: 22.23%
Distance from breakout buy point: 0.44%
Volume 31.67% above its 15 day avg.
Trade Idea:
* You can get in now (at $38.44) as the price is just breaking out
* If you want a better entry you can look for one around the 37.7 area if it comes back down
* Right now it does seem to be gaping up so I wouldn't chase the price... Lets see how it behaves after the gap up and offers another entry
* This stock usually has local tops when the price closes around 15.28% above its 50 EMA
* Consider selling into strength if the price closes 15.08% to 15.48% (or higher) above its 50 EMA
* The last closing price is 7.64% away from its 50 EMA

Is $DE ready to move higher from here?Notes:
* Very strong up trend
* Great earnings track record
* Was basing for about a year before volatility kicked it around to both the up and down side of the base
* It's currently back within that base (between 394.4 and 323.5)
* Last weeks close had strong volume coming in (above average)
* Recently came back above the $357.1 mark on the weekly, which seems to be a battle ground for bull and bears (with higher than average volume)
* Was consolidating tightly all of last week with increasing volume and broke out of that consolidation on Friday with abnormally high volume
* Currently offering an early entry and a pocket pivot
Technicals:
Sector: Industrials - Farm & Heavy Construction Machinery
Relative Strength vs. Sector: 1.02
Relative Strength vs. SP500: 1.18
U/D Ratio: 1.2
Base Depth: 53.52%
Distance from breakout buy point: -16.72%
Volume 208.01% above its 15 day avg.
Trade Idea:
* You can enter now as the price is just breaking out of consolidation with higher than average volume
* If you want a better entry you may be able to get one around the 361.9 area if it comes back within the consolidation range
* This stock usually has local tops when the price closes around 13.34% above its 50 EMA
* Consider selling into strength if the price closes 13.14% to 13.54% (or higher) above its 50 EMA
* The last closing price is 8.67% away from its 50 EMA

Can $DLTR push higher from here?Notes:
* Very strong up trend on all time frames
* Great earnings in the recent quarters and in general
* Creating a base on base pattern for the past ~8 months
* Price is mostly keeping above its 50 day line since mid April with a few dips below
* Volatility is contracting with signs of accumulation
Technicals:
Sector: Consumer Defensive - Discount Stores
Relative Strength vs. Sector: 2.58
Relative Strength vs. SP500: 3.05
U/D Ratio: 1.24
Base Depth: 36.34%
Distance from breakout buy point: -3.83%
Volume 17.45% above its 15 day avg.
Trade Idea:
* You can enter now as the price is just above its 50 day line with increasing volume
* If you want a better entry you can look for one around the $163.7 - $162.1 area as that should hold as support
* This stock usually has local tops when the price closes around 15.72% above its 50 EMA
* Consider selling into strength if the price closes 15.52% to 15.92% (or higher) above its 50 EMA
* The last closing price is 2.4% away from its 50 EMA
Caution:
* Earnings are coming up and the stock could move either way. If you want to play it safe, wait till after earnings to jump in.


XAUUSD Trend Analysis For Buy and Sell SetupXAUUSD is Heading Low as Expected from 1800s and got Rejection from 1.618 and Heading Sharpley Towards 2.618 area Which is perfect Zone with Two Confirmations 1. Resistance Become Support Zone 2.Rally Base Rally (Demand Zone) on the 1 Hour Time frame.
Should XAUUSD comes to 2.618(We can Create Buy Positions) and We can see a Sharp Increase to the upper Supply Area Which is Around 1754 area and Get rejection from that area(You can Place Sell orders).
Happy Hunting ;)
Regards
MuSaQ Forex

GoldViewFX - 1H CHART UPDATED LEVELS & TARGETSHey Everyone,
We have updated the 1H chart with the most upto date weighted Goldturns.
Technically we have broken 1755 Goldturn opening the lower Goldturns, However if we see price find support at 1742 then we will see a challenge at 1747 and 1755. We will then look for EMA5 CROSS AND LOCK above 1762 to open the upper targets with a AXIS target at 1786. Failure to break 1762 will see price back in the Bearish Goldturn channel into the lower targets.
We are at a central range so it will will be critical to trade this level to level using the Goldturn break and close strategy to determine move level to level.
We need to take extra caution trading this week due to JACKSON HOLE this week and can expect big moves in either direction. A lot of the sentiments are being priced in as we saw negative pressure on Gold already last week.
BULLISH TARGET
1747
1755
1762
BEARISH TARGETS
1742
1736
1730
SWING RANGE
1723 - 1716
The best way to trade JACKSON HOLE is to wait for the move and patiently let the momentum exhaust, measuring the momentum using the Goldturns. Ideally we would like to see movement down as deep as the momentum allows, establish a floor and then organically ride the movement up. If it heads up from the start then we already fall in line with our long term projections for Gold with our Axis target providing exit should we decide to get in on any buy signals in VIP.
As always we will keep you all updated with any changes to our plans throughout the week. Please don't forget to like, comment and follow to support us, we really appreciate it!
GoldViewFX
XAUUSD TOP AUTHOR

btcusdt longDear friends and companions, as you can see, the previous signal hit the target very accurately and the chart is talking to you.I will make a purchase from here with a target of 24000 and a loss limit of 20700. Don't forget to like and comment.

$KBR is showing signs of moving higher!Notes:
* Very strong up trend since 2016
* Great earnings track record
* Basing for the past ~5 months
* Created a double bottom and is now approaching the top of the handle
* Recently bounced off of its 50 day line
* Offering a low risk entry
Technicals:
Sector: Industrials - Engineering & Construction
Relative Strength vs. Sector: 2.23
Relative Strength vs. SP500: 2.26
U/D Ratio: 1.52
Base Depth: 28.54%
Distance from breakout buy point: -7.85%
Volume 10.62% above its 15 day avg.
Trade Idea:
* You can enter now as the price is still close to its 50 day line on stable volume
* If you're looking for a better entry you can look for one around the 51.8/9 area as that should hold as support
* If you're looking for a safer entry you can wait for a break and hold above 53.26
* This stock usually has local tops when the price closes around 15.01% above its 50 EMA
* Consider selling into strength if the price closes 14.81% to 15.21% (or higher) above its 50 EMA
* The last closing price is 4.37% away from its 50 EMA

S&P 500 Signalling Buying Opportunities?As expected, the S&P 500 has reacted to the daily 200 simple moving average
which is acting as resistance.
Basic indicators such as the moving average can tell us before the fact where
price may struggle and potentially reverse.
This move is not a reversal at the moment, a barrier has been formed, and it
will just take the buyers a bit more effort to break above this level.
We have seen some bullish impulsive moves recently, and if the long-term trends
are still intact, then the 200 sma should be broken soon, and then we want to
see price go on to create new all-time highs. Patience for now, but we may soon
be looking for buying opportunities again.
If you like enjoyed this post, make sure to like, and follow for more quality content!
If you have any questions or comments, comment below. We reply to every comment!
See below for more information on our trading techniques.
As always, keep it simple, keep it Sublime.

HOTUSDTHello my dear friends
According to the shadow of the candles, higher ranges have been consumed.
On the condition of maintaining the range of the specified flag limit ($0.00258), we can expect the formation of an increasing trend up to the specified range.
We would be happy to hear your comments.

$ZGN an IPO coming up on the right side of its base!Notes:
* Coming up on the right side of its IPO base
* Has been using its 50 day line as a dynamic level of support
* Recently broke above an important resistance level around 11.22 with higher than average volume
* Has been increasing steadily in price and volume
* Printed a pocket pivot with squatting price action (not ideal)
Technicals:
Sector: Consumer Cyclical - Apparel Manufacturing
Relative Strength vs. Sector: 1.04
Relative Strength vs. SP500: 2.37
U/D Ratio: 3.51
Base Depth: 39.96%
Distance from breakout buy point: -9.73%
Volume 117.75% above its 15 day avg.
Trade Idea:
* I particularly don't like the squatting price action at the moment so I personally wouldn't enter now.
* If the price holds above 11.22 and stops squatting I may consider entering
* If you want to enter now you can as the price is just above the broken resistance level of 11.22
* If you're looking for a better entry you may just want to wait and see how the price behaves around this level
* I'll post about this again if it makes better progress.
