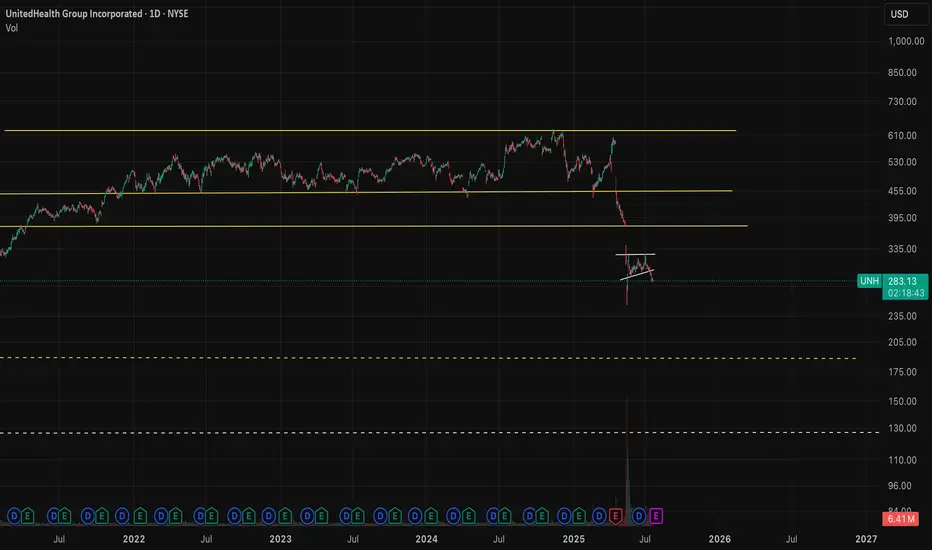
Buying when others are fearful! - Technical breakdown looks ugly but biting the bullet with a strong conviction that bad news are priced in.
- Risk is to the upside. Even if it goes down, I'm mentally ready to buy more of NYSE:UNH and let it compound for years to come.
- I believe that we should close the gap above @ $376 so we have around 35-40% upside by the year end.
Buythedip
Is it finally time for a rally?Looking at NVIDIA (NVDA) on the weekly chart over the past two years, a significant gap up becomes apparent around April, which persisted for much of the year. Considering the recent news and the stock's pullbacks lately, this may be the moment for NVDA to resume its upward grind. The coming weeks will reveal its direction.
Additionally, it's worth noting the formation of a massive bull pennant on the weekly chart. If history repeats itself and this pattern holds, the next 2 to 6 weeks could prove to be a thrilling period for NVDA.

Nike Looks Ready — A Smart Time to Consider InvestingOn the monthly chart, NIKE has been in a downtrend since November 2021, but the signs are pointing toward a potential trend reversal. Here's why I believe the bottom may already be in:
✅ MACD Histogram shows a strong positive divergence, signaling weakening bearish momentum.
✅ The RSI downtrend line has been broken and successfully retested, confirming bullish strength.
✅ A clear hammer candle has formed at a historical wide support zone, showing strong demand.
Now, price is facing three consecutive resistance levels — and with each breakout, the next zone becomes the new target, (87.5 → 102 → 122).
The structure suggests a step-by-step move higher if momentum holds. Keep an eye on the breakout above the descending trendline — that’s where things could accelerate.

GOLD Goes "Buy The Dip", Following 200-hour SMA Major SupportGold prices have experienced significant volatility over the last days, with conflicting reports on the current trend. According to some sources, gold prices have increased, with spot gold reaching $3,500 per troy ounce, new all the history high on Tuesday, April 22, 2025.
The $3,500 milestone has sparked increased interest from investors and market analysts, meaning that Gold spot doubled in price over the past 5 years, 3rd time in history ever.
Despite the short-term volatility, gold has shown a strong performance since the beginning of 2025, with an increase of approximately 30-35% year-to-date. Market analysts remain bullish on gold, with some forecasting prices to reach $ 4'000 per ounce in the near term.
The main 1-hour Gold spot OANDA:XAUUSD graph indicates on 200-hours SMA technical support, with further upside opportunity due to forming on the chart descending triangle (flat bottom/ descending top) breakthrow.
--
Best #GODL wishes,
💖 Your Beloved @PandorraResearch Team

Nasdaq - This Is Still Not The End Yet!Nasdaq ( TVC:NDQ ) cannot resist bearish pressure:
Click chart above to see the detailed analysis👆🏻
Over the past three months, we saw such a harsh correction on the Nasdaq that a lot of people are freaking out entirely. However technicals already told us that something feels wrong and this is the result. If we see another -10% from here, buying the dip will most likely pay off.
Levels to watch: $16.000
Keep your long term vision,
Philip (BasicTrading)

Bullish??? That was all very sudden, is it over now?The market correction really seamed to be an over reaction. I am hopeful that the worst is behind us, at least for the meantime.
maybe this will be closer to 2018 correction and we just keep grinding higher for the rest of the year. I suppose anything is possible.
-Everyone got way to bearish to quick - Spidey senses going off!
-we never copy and paste last cycle to the next, but people have such a recency bias, sometimes its all they can see ( I may know from experience)
- hopefully bullish

Long Coinbase as a proxy bet on Crypto until end of yearUntil proven otherwise I must be under the assumption that the worst is behind us for the time being. That being said, more debasement is infinitely more likely than less, so long risk assets.
-looking for a lovely retest of the broken downtrend, coinciding with a nice support level within the next 30 days. This has to be a buy for me (in the green box).
-looking to close position late this year (likely December)

What on Earth Is a Circuit Breaker?!Every couple of days since April 2nd, everybody's been talking about a stock market halt all day. You're left there trying to Google it so you're not the only person in the group chat who doesn't know what's going on. But actually, nobody else in your group chat knows what's going on either. They're low-key Googling it under the desk. You don't have to know everything in the market to be a "seasoned" trader. What does get disappointing is when people guess instead of providing facts or a direct link to an article about market halts.
So, this is your quick-but-detailed-read article/ guide to market halts and circuit breakers. Send it to your friends in that group chat. Why today's dump happened in the first place? More on that later. It's a long story. 🥹
What is a circuit breaker?
It's simple: a circuit breaker is a 15 minute OR whole-day market-wide HALT when the market reaches 1 of 3 decline levels. It all depends on the level, how fast the decline is, and potentially other factors that we are not aware of. Keep in mind this is not something we have to deal with often.
When does it happen? And what stock does it track?
Good question. The halt is triggered following declines in the S&P 500 only . That is: AMEX:SPY SP:SPX $CME_MINI:ES1!.
If these level 1 & 2 are reached before 3:25 PM EDT , there is a 15 minute market-wide trading halt. Meaning you cannot enter or exit positions. If level 3 is reached at any time in the day, the entire day's trading will come to an end.
Level 1: -7.00% | 15 minute halt
Level 2: -13.00% | 15 minute halt
Level 3: -20.00% | Entire day halt
So when the S&P 500 index reaches -6.98%, be sure a halt is coming very soon at -7.00%. Sure, like today, "they" might pump it and use that as support and prevent a halt (we got very close to -6.35% on CME_MINI:ES1! if I'm not mistaken). But it's good to be vigilant and make sure you're not in any daytrades.
Does CME_MINI:NQ1! NASDAQ:QQQ CBOT_MINI:YM1! trigger the halt also?
No. The halt is only triggered by the S&P 500. The Nasdaq Composite famously moves much more than S&P 500, so a 7% drop in S&P is way more dramatic than a 7% drop in Nasdaq and it's highly likely at -7% in S&P that Nasdaq would be at -8% or -9%. Although, both are undoubtedly decimating for any long positions.
Why does this rule exist?
This was introduced after Black Monday of 1987 where the market was free falling ( DJ:DJI dropped 22.6%) with no safety stops in place to prevent a market-wide disaster. This prevents further panic selling and massive stop loss raids, and also gives institutional traders time to zoom out and see the bigger picture.
How close did we get recently?
Today we got within 0.7% of getting a 15 minute halt.
See for yourself:
And the intraday 15 minute chart:
FUN FACT: What if I shorted the top on CME_MINI:ES1! ?
Assuming your time machine goes back 24 hours (some time machines only go back 10 years minimum), you'd have booked 1500 ticks at $12.50 per tick. So around $19k per contract. You know that's not too bad. It's almost a Toyota Camry per contract. Do better! 😆
How do I trade this?
Do you really have to? Please do not FOMO & catch a falling knife. Trade light. The market is open for the rest of the year. Trade with a stop loss, and remember, if you FOMO'd and bought at -3% just because it's down 3%, you'd have gotten decimated. Use the charts not the % on your screen. 🔥
Hit the follow button for free educational content because knowledge is free. KD out.

ETHEREUM REVERSAL INCOMING !!!!Ethereum formed major bat harmonic pattern and now approaching to it's Potential Reversal Zone. Also with that, it's approaching to it's range low. We can expect sweep of range low, although 1400-1200$ region is strong PRZ after that targets would be straight towards 4500-5000$

TOTAL3 UPDATE!!! GET YOUR ALTS BAGS READY !!TOTAL3 has reached PRZ zone of bat pattern aligning with elliott wave count. Frrom here we may see major shift in alts. Get ready for the ultimate altseason boyz!!!

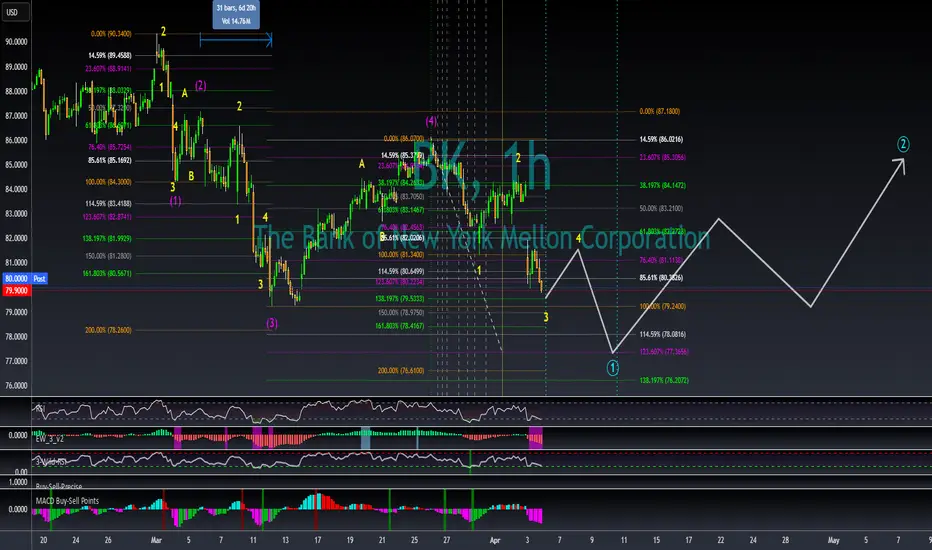
More downside for BK?My overall thesis is we are in the very early stages of a multi-year decline ultimately with the S&P 500 below 3500. I am estimating this symbol to be in wave position SuperCycle 2, Cycle A, Primary 1, Intermediate 5 and around the end of Minor wave 3.
The overall target bottom for Intermediate wave 5 and simultaneously Primary wave 1 is below Intermediate wave 3's low of 79.2315 from 12 March 2025. A movement extension to target is 78.00738 (114.59%) or 77.3584 (123.607%) and is depicted by the far right levels and percentages. Intermediate wave 3 was 31 trading hours long. The application of Fibonacci percentages to 31 trading hours is displayed by the vertical lines. The green vertical line represents the start of wave 5. The solid yellow line is 31 bars (100% of wave 3's trading hours). 161% and 261% are the light blue dotted lines thereafter. The current target bottom is around midday on 10 April.
If we are currently in Minor wave 3 of Intermediate wave 5, the target bottoms are 80.2234 (114.59%) or 79.5333 (138.197%) and depicted by the middle levels and percentages. The hourly chart is currently in the middle of signaling wave 3 which likely means we are looking to finish Minor wave 3 with today's close or within the first hour of trading tomorrow. As of the open tomorrow Minor wave 3 would only be 13 hours long which is shorter than wave 1. This likely means Minor wave 5 will be 13 hours or less whenever it begins.
I will begin more specific calculations on Primary wave 2's top once we finished Primary wave 1 likely next week. The very preliminary estimate if Primary wave 1 ends around 11:30 on 10 April would have seen Primary wave 1 last 198 trading hours and drop nearly 13.00 points. Primary wave 2 could top around 85.38 around 7 May.
Baidu Inc. (BIDU) 1WTechnical Analysis 1W
A breakout from the "falling wedge" could signal potential upside.
Key levels:
-Support: 94.26 | 77.24
-Resistance: 107.61 | 116.99 | 156.75
Fundamental Analysis
-AI Leadership: Baidu continues expanding in AI, cloud computing, and autonomous driving.
-Financials: Solid revenue growth but faces regulatory risks in China.
-Competition: Strong rivalry with Alibaba and Tencent in AI and cloud services.
-Risks: U.S.-China tensions and economic slowdown may impact performance.
A breakout above $116.99 could confirm further upside.

NKE Trade Alert – Earnings Shakeout = Huge Opportunity!Nike (NKE) just dropped some earnings news that could pressure the stock in the short term. A price dip = a golden buying opportunity! Smart traders are watching these levels closely.
📉 New Entry Zones:
🔥 68.00 (Buy zone)
🔥 65.00 (STRONG buy)
🔥 60.00 (Deep discount level)
🎯 Profit Targets:
✅ 78.80 📈 (Solid first target)
✅ 82.50 🚀 (Momentum play)
✅ 88.50 💰 (Moonshot!)
💡 Market volatility = trader’s dream. A dip could fuel a massive rebound. Watch for accumulation in the buy zones!
🚀 Ready to catch the bounce? Let’s trade! 💸🔥 #NKE #StockMarket #BuyTheDip
📌 Disclaimer: This is not financial advice. Always do your own research and consider consulting with a financial professional before making investment decisions. 🚨

BITCOIN (BTC/USD)BTC/USD – Technical Outlook
Bias: Bearish
BTC/USD has completed the ABCD pattern and is now printing lower highs and lower lows, confirming a shift in market structure to bearish.
Price is currently retesting a previous support, now turned resistance. If this level holds, it could open the door for continued downside; with the 68K–50K zone as a potential BTD (buy-the-dip) area.
TARGET 1 (78K):
A key structural zone. A clean break and close below this level would confirm bearish momentum and increase the likelihood of price falling.
TARGET 2 (66K):
Likely to act as a magnet; a previous resistance turned support that launched price toward 100K. A return here would retest the foundation of the previous rally to 100k.
TARGET 3 (50K):
From a fractal and psychological standpoint, double tops often retrace to the origin of the bullish move. In this case, around the 50K zone.
Invalidation:
A reclaim of 85K–90K would shift bias back to bullish, signalling potential for upside momentum.

Use Buy The Dip Like a LynchWhile we can’t say for certain that Merrill Lynch specifically uses VWAP (Volume Weighted Average Price) in their strategies, one thing is clear: they certainly rely on sophisticated statistical tools and data-driven insights to inform their investment decisions. Merrill Lynch, known for its expertise and successful track record, employs a range of techniques to navigate market fluctuations and identify profitable opportunities.
In the fast-paced world of trading, every decision counts. One strategy that has stood the test of time is Buy the Dip (BTD). This approach involves buying assets after they’ve experienced a temporary drop, anticipating that the price will bounce back 📉➡️📈. However, timing the dip correctly can be challenging without accurate data and predictive tools.
This article explores how to enhance your Buy the Dip predictions using OHLC Range Map and 4 VWAPs set to Century on TradingView.
What is the Buy the Dip Strategy? 🤔
The Buy the Dip (BTD) strategy is simple yet effective. Traders buy an asset after its price has fallen, believing that the dip is temporary and the price will soon rise again 📉➡️📈. The challenge, however, is knowing when the dip is truly an opportunity rather than the start of a longer-term downtrend.
This is where data-driven insights come into play. Rather than relying solely on intuition, having the right tools can make all the difference. With the OHLC Range Map, traders can gain a clearer understanding of price action, which helps identify whether a dip is worth buying 💰.
Strategies for Predicting Buy the Dip Levels 📍
Spot the Dip Using 4 VWAPS set to Century
Spot the Dip Using OHLC Range Map
1. Spot the Dip Using 4 VWAPS set to Century 🎯
Load 4 VWAPs on the chart, and configure them as follow:
1st VWAP: Source - Open, Period - Century
2st VWAP: Source - High, Period - Century
3rd VWAP: Source - Low, Period - Century
4th VWAP: Source - Close, Period - Century
When the price approaches key support or resistance zones, such as VWAP bands, particularly for well-established assets like ES, NQ, BTC, NVDA, AAPL, and others, there's a high probability of price reversal.
By combining this with price action analysis, you can identify precise entry points for a position with greater accuracy.
2. Spot the Dip Using OHLC Range Map 👀
The OHLC Range Map is a powerful statistical tool designed to plot key Manipulation (M) and Distribution levels over a specific time period. By visualizing these levels, traders can gain insights into market behavior and potential price movements.
For example, when analyzing the ES chart, we can observe that the bearish distribution level has already been reached for the next 12 months. This suggests that the market may be poised for a reversal, with the expectation of higher prices in the near future. By identifying these critical levels, traders can anticipate market trends and adjust their strategies accordingly.
Key Takeaways 🔍📊
Buy the Dip (BTD): The BTD strategy involves buying assets after a temporary price drop, expecting a price rebound.
Enhancing BTD Predictions: Using OHLC Range Map and 4 VWAPs on TradingView improves the accuracy of Buy the Dip predictions.
Spotting the Dip with 4 VWAPs: Configuring 4 VWAPs (Open, High, Low, Close) on a chart helps identify key support and resistance zones for potential price reversals.
Using the OHLC Range Map: The OHLC Range Map helps pinpoint Manipulation and Distribution levels, aiding in market trend anticipation and timing.
Combining Tools for Precision: Integrating the OHLC Range Map and VWAPs with price action analysis allows for more accurate Buy the Dip entry points.

ENA Breaks Downtrend – Is a Rally Incoming?$ENA/USDT 12H chart shows a breakout above the resistance trendline and the 50 EMA, indicating a potential trend reversal. However, the price is currently facing resistance near the previous support-turned-resistance zone.
A retest of the trendline breakout is possible before further upside. If the price holds above the trendline and reclaims support, it could confirm a bullish continuation.
However, failure to hold may result in a fakeout and further downside.
DYOR, NFA

$HIMS - Please give us this DIP!If the gods bless us we can have a DIP BUY on NYSE:HIMS at $42-$48 range!
Have a GAP to fill at $46.34 as well.
Earnings Monday after the bell, could be the last time to see NYSE:HIMS at these levels if they crush!
Not financial advice

Understanding Buy The Dip In TradingBuying the dip is a trading strategy where you take advantage of temporary price drops in an overall uptrend. The goal is simple: enter the market at a lower price before it resumes its upward move. It sounds easy, but knowing when and how to do it makes all the difference. In this guide, we’ll explore key setups, ideal market conditions, and smart risk management techniques to help you trade dips like a pro. 🚀
1. Understanding Market Structure 🏗️
Before jumping into a trade, it’s crucial to understand how price moves. A strong uptrend is characterized by higher highs and higher lows—this is where buying dips can be very profitable. But beware: not every drop is a buying opportunity. Some dips are part of a pullback, a temporary retracement before the trend resumes, while others signal a complete reversal—the last thing you want to buy into.
Key levels to watch include support zones, Fibonacci retracement levels, and high-volume areas. These zones act as potential turning points where the price is likely to bounce.
2. Proven Setups for Buying the Dip 🎯
🔢 Fibonacci Retracement Support
When the price pulls back within a strong trend, it often lands on key Fibonacci levels like 38.2%, 50%, or 61.8%. These act as natural support points where buyers step in. If a strong bullish candle appears at one of these levels, it can signal a solid dip-buying opportunity.
Combine this with an oversold RSI and rising volume, and you have a strong case for entry.
🎭 Liquidity Grab (Stop Hunt)
Markets love to shake out weak hands. Sometimes, the price dips below a previous low, triggering stop-loss orders before reversing sharply. This is called a liquidity grab—smart money accumulates positions while retail traders panic.
If the price quickly reclaims the level it just broke, it’s a strong buy-the-dip signal. Look for big buy orders, a sharp recovery, and bullish candlesticks to confirm entry.
📊 Anchored VWAP Test
Institutions often base their trades around VWAP (Volume Weighted Average Price), especially when anchored from a significant swing low. When the price revisits this VWAP in a strong uptrend, it’s a potential dip-buying zone.
Watch for bounces off VWAP, rising volume, and confluence with other support levels for confirmation.
🔥 Point of Control (POC) Revisit
Markets move towards areas of high liquidity. If the price revisits the Point of Control (POC)—the price level where most volume is traded in a range—it often serves as strong support.
When price pulls back into the POC and finds buying interest, it’s a great spot to enter. Look for strong reactions, failed attempts to move lower, and confluence with Fibonacci levels.
📏 Previous Range Support
A breakout from a trading range is significant, but the price often returns to retest the range high as new support before continuing higher. If this happens on low selling pressure and aligns with moving averages or VWAP, it can be a golden buy-the-dip opportunity.
Look for bullish reactions, buying volume, and strong candles off the level.
3. When Buying the Dip Works Best ✅
Not all dips are worth buying. The best setups occur when:
The market is in a strong uptrend, making higher highs consistently. 📈
Volume is high, showing that buyers are stepping in. 🔥
Macro conditions support upside movement, like favorable economic news. 📰
4. Risk Management: Protecting Your Capital 🛡️
Even the best traders take losses. What matters is how you manage risk:
Set a Stop Loss 🎯: Always place a stop below key support levels.
Position Sizing 📊: Never risk more than a small portion of your capital per trade.
Have an Exit Plan 🚪: Know where you’ll take profits, whether it's at a resistance level or a trailing stop.
Scale In and Out 🎢: Enter gradually instead of all at once, and take profits along the way to lock in gains.
Key takeaways 🎤
Buying the dip can be a powerful strategy—when done correctly. The key is patience: wait for strong trends, allow price to reach significant levels, and confirm with volume and momentum. Combine technical analysis with solid risk management, and you’ll improve your chances of success in the markets. Happy trading! 🚀

NVIDIA Price Rebalance to 132$You most likely already know that most retail traders lose money.
With the fear of new cost efficient AI news most people shorted NVIDIA. Whatever the name of the AI and whichever the country it is and however efficient it is, it will still run on hardware and as of now NVIDIA is the biggest hardware maker. This is the chance to buy since price did not go down in a healthy price action.
We expect a recovery to equilibrium of the inefficient drop of price at 132$
Please comment any questions you have.
Happy and safe trading!

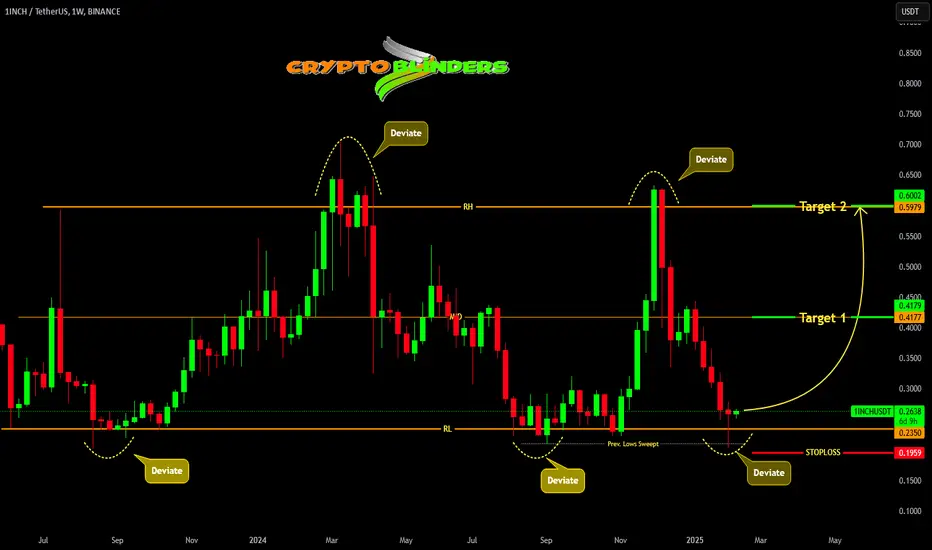
1INCH ABOUT TO MAKE A BIG MOVE !!!1inchusdt been trading in a range, had recently swept previous lows and deviated range low and reclaimed it. It signs a strength and we can expect targets of mid range and range high putting stops below recent low.
ETH: Sell the Pop, Buy the DipOverall Vibe: We're seeing a bit of a mixed bag here. ETH had a nice run-up, but it's starting to look like it might be running out of steam.
The Sell Zone: You've marked a key area around $3,053.38 as a "Sell Zone." This tells me you think there's a good chance we'll see some selling pressure kick in around that level. Smart move to call that out.
Potential Dip: If things play out like you expect, you're anticipating a dip down to around $2,622.10, maybe even lower. That's where your "Buy Zone" comes into play.
Why This Makes Sense: Looking at the chart, I see a few things that support your analysis:
Resistance: The $3,053 area lines up with some previous resistance levels. That's a classic spot for sellers to step in.
Heikin Ashi Candles: These candles smooth out the price action and can make it easier to spot trends. I see some red candles forming, which could signal a shift to the downside.
Keep in Mind:
Market's Gonna Do What It Wants: No chart is 100% accurate. Be ready to adapt if the market throws a curveball.
Risk Management is Key: Always have a plan for how you'll manage your risk if the trade goes against you.
Overall:
Not bad at all! Your analysis is clear and well-reasoned. I like how you've identified key zones and explained your thinking. Keep an eye on those levels and see how it plays out.
Disclaimer: I'm just an AI, so this isn't financial advice. Always do your own research before making any trades.

BTC IS GOING TO 130K !!!
According to #BTC Elliott wave micro count, currently we are into 2nd wave which can end up to 96-92.5k region.
After that we may probably see impulse 3rd micro wave move up to 115K and final 5th micro of 3rd major impulse wave up to 130K.
Invalidation of micro count is below 91K !!!

Silver XAGUSD defies them all. Breakout 1Hr
You can see the 1Hr candles from earlier this morning NY time where the squeeze was on.
I think that this Tariff' business of Donny's will include some volatile days but from my understanding & in only the past 24 hours that whole thing will actually be supportive of the Gold price and Cryptocurrency's amidst some fear sellers from time to time.
