Buythedip

DASH, Will the Downtrend ContinueDASH is in a solid downtrend right now. Buy the dip!! I think this stock will recover very well. Good luck.

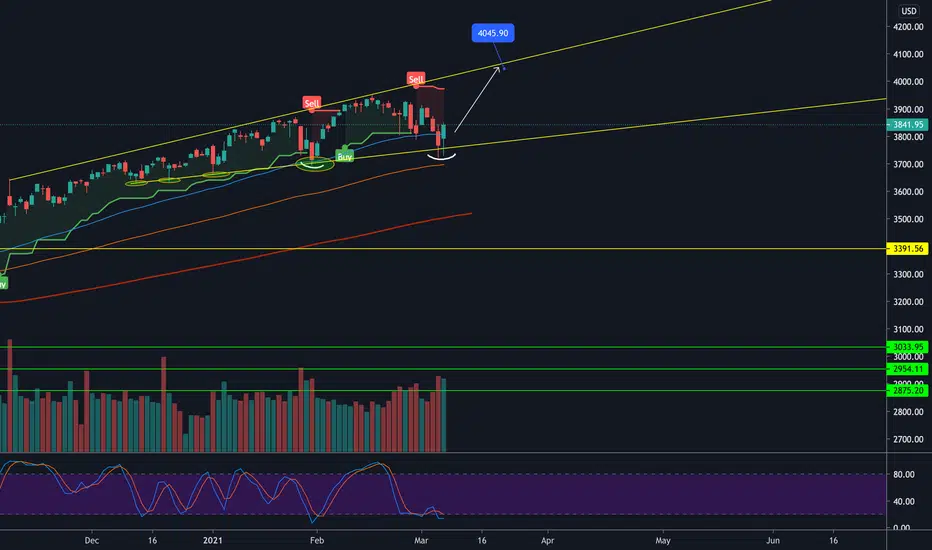
Clover Health Continues To Track The Broader Market Very CloselySince the market started selling-off late February due to disturbance in the bond market, the movements of $CLOV has since been mirroring the direction of the overall market relatively tightly. With the closing of the market earlier today after a considerably sideway and mixed trading day, S&P 500 rose by 0.60%, NASDAQ fell by 0.04%, while Dow Jones Industrial Average rose by 1.46%. Similarly, $CLOV also had a relatively mixed trading day, showing green for the first half of the trading session, and later closing slightly red on the second half. These movements can be attributed to the general market condition as well, where during the first half of the trading session, the release of bullish CPI data edged the market higher, while a relatively average and within expectations $38 billion 10-year notes auction brought the action back down to trade relatively sideway.
I expect $CLOV to continue tracking the overall direction of the market closely, at least for tomorrow, where we await for the result of a $24 billion sale of 30-year bond that can potentially move the market significantly in either direction, should anything unexpected occur.
Regardless, it is good to note that on a technical perspective, $CLOV is approaching some key trading area that we need to take note of.
We are currently resting just below the dynamic resistance formed by the bottom of the previous bearish channel that were trading in before this bond-induced market correction. While we may have already rejected this area once (likely due to the broader market movement as mentioned above), if we are able to break back into the bearish channel, our next target would be the next Fibonacci resistance and the top of the aforementioned bearish channel at around $9.92. However, if we fail to break back into it, we could be looking at a re-test of $7.78 or even $6.67. As such, tomorrow's trading session will likely be a very important one as it will give us an indication of where we are headed short-term.
Invest safe.
This is not investment advice so please do your own due diligence!
Support this idea with likes and share your thoughts below.


Re-entry after bullish run on FridayRecent pull-back in NASDAQ from all time highs has exceeded 10% driven by falling treasury bond prices.
Friday saw an end of week rally into close. This morning saw another sell-off through the Asian session presenting an attractive re-entry opportunity.

Weekly Outlook! 3/8 - 3/12 Here's our weekly market outlook! we go over last weeks video and go over some names we are watching in the coming week!

U reach the dip ?!Fundamental:
U has a very good fundamental as ARK Invest keeps collect on the first day of the sharp drop.
I believe ARK will keep collecting the ticker as the fundamental is still there.
The gaming sector will keep growing especially everyone stay at home.
-Stochastic showing oversold which warren buffet once said that it is wise for investors to be
“fearful when others are greedy, and greedy when others are fearful.”
Technical Analysis:
1. head and shoulder: after breaking the neckline they will meet the same portion at the support which is 110
2. Fibo 50 is supporting at 120
3. Divergence of Stochastic is showing higher low
I will make a collection of those 2 entries with convincing for long investment, plan to hold for months
**Disclaimer: Buy at your own risk!

UBERthe pull back to $48 never happened I did load up on more uber at $52 and I just love this giant inverted head & shoulders. I think UBER does v very well heading towards the end of 2021

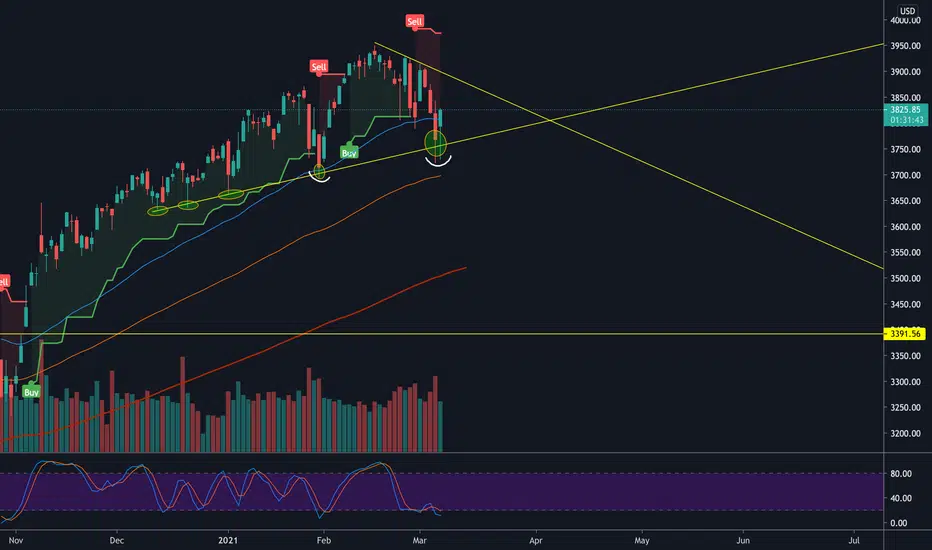
Clover Health Rallies Despite An Early Sell-off Into A $6.31 LowThe movement of $CLOV continues to mirror the condition of the overall market. Today, the tech-led sell-off took a pause, with S&P 500 rising by 1.95% and NASDAQ Composite rising by 1.55%. Similarly, Clover Health ended higher by 7.54%, closing above the previous day's close.
Going into next week, I expect $CLOV performance to continue reflecting the overall market condition. Nevertheless, these are some notable resistance and support area that you should take note next week, with key areas highlighted in Bold:
Psychological resistance: $8.00 , $8.50 , $9.00
Psychological support: $7.50, $7.00, $6.50 , $6.00
Fibonacci resistance: $9.92
Fibonacci support: $7.78, $6.67 , $5.07
Dynamic resistance: Bottom of the previous bearish channel that we were trading in before this market correction ( ~$8.50 )
Dynamic support: Top of the very tight bearish channel that we just broke out of (~$7.10)
Once this correction is over, I expect $CLOV to emerge as one of the winners.
Invest safe.
This is not investment advice so please do your own due diligence!
Support this idea with likes and share your thoughts below.


How to Correctly BUY the DIP?I've been in this trade for some time now so I thought I would share my approach on How I Successfully buy the dip.
Hope you enjoyed my first tutorial, many more to come.
Follow me and stay tuned on many more ideas and tutorials from an Insider.

PTON trend bounce?Looks like PTON is primed and ready for a solid trend line bounce, we bounced off oversold levels on the RSI, showed now weakness in the A/D, and we are also sitting a sold Fib levels which i lay out in the video. Overall i think this is a great dip to buy here for PTON NASDAQ:PTON

Weekly Outlook! 3/1 - 3/5Here we go over last weeks video and we take a look at a few things we are keeping an eye on for the coming week!

BTCUSD - Buy the dip?I saw an area of confluence at around $40k - $42k. As you can see, the 161.8% and 61.8% Fibonacci retracement also the 55 daily EMA is currently sitting in that area. When the price reaches that area, there's a high probability that the price would rebound. So the $40k - $42k level is considered as a pretty good buy area. But there's also a probability that the price would go through that buy area and bounce off from the 21 weekly EMA (147 daily EMA).


WKHS Beat Down. WKHS has been beaten down over the past week, dropping nearly 60% in share price. Good buying opportunity?

Silver: Buy the Dip or More Downside Risk Ahead?The bias for TVC:SILVER remains to the upside. The recent slight bounce in the dollar, which has occurred sooner than originally expected, has contributed to last Friday's selloff in commodities. Until proven otherwise on the chart, this recent shakeout remains a buy the dip opportunity and a great place for new buyers to establish initial positions.
Everything shared here is only my opinion and no results are guaranteed. Good luck!

Southern Silver Exploration Corp. Almost Ready to ExplodeHigh risk / high reward play for OTC:SSVFF . A close below the arc would invalidate the bullish thesis.
Everything shared here is my own opinion and no results are guaranteed. Good luck!

APPS - consistent returnsSelf explanatory. Buy the dip, good to have cash on hand to seize the opportunities the market presents. Not always good to leave money on the table.
Switch the chart to candles and you can identify some great bullish candles at the reversal. Tweezer bottom got me looking at buying calls. The buy signal confirmed it. Ride the wave up and set the stop loss for some good risk/reward. Next signal was clear momentum play as the price moved above the cloud.
Safe trading! Like/Share!

/ES pulling a setup for a tighter leg up.H/s formation atm with a base measure and sprt target zone of 3820-3807. A buy alert set for 3820 with a stop 3805. Measured move of h/s and fib measure indicates another attempt at ATH and zone levels 3987 as a primary target to an extension of 4021. All invalidated with a trade below 3807, which is been a pivot on the hourly since 01/7/21.
