ARE YOU READY TO RIDE WITH NEO!!!Get ready fellas,
Captain NEO is about to take off 🚀
see you at mars
Buythedip

CHROMIA READY TO EXPLODE !!!CHROMIA getting ready to take of 🚀
Don't under estimate this beast will melt the faces soon


Reg Optimism, Implicit Fed Support, & Insti Demand to Boost BTCBitcoin prices surged on President Trump’s inauguration day (Jan 20), reaching an all-time high of USD 109,000. However, since then, prices have stagnated. Recent tariff announcement has driven a sharp selloff.
Optimism about a crypto-friendly Trump administration continue to fuel bullish sentiment, but the lack of concrete regulatory guidance has limited near-term momentum.
MACRO FACTORS AT PLAY
BTC remains below key resistance levels, limiting upward momentum. However, it has outperformed equities in the current macroeconomic environment. While equities faced an AI-driven selloff last week, BTC showed resilience, rebounding quickly from its Jan 24 lows. Additionally, BTC has benefited from market uncertainty, like gold, which is also trading near an all-time high.
The recent FOMC meeting initially pressured BTC, as the Fed held rates steady and expressed inflation concerns. However, BTC rebounded 2.4% after Fed Chair Powell clarified that changes in inflation-related language were not intended as a strong signal.
Source: CME FedWatch
The Federal Reserve’s latest dot plot suggests only two rate cuts in 2025. Market expectations, per the CME FedWatch tool, align with this outlook. While a higher-rate environment limits tailwinds for BTC, bullish sentiment continues, driven by regulatory anticipation and increasing institutional and sovereign adoption.
BREAKING DOWN TRUMP’S EXECUTIVE ORDER
On Jan 23, President Trump issued an executive order titled "Strengthening American Leadership in Digital Financial Technology." The order emphasizes fostering digital asset growth while maintaining U.S. financial sovereignty, particularly through USD-backed stablecoins. It also protects citizens’ rights to use blockchain networks without government interference.
Key provisions include:
1. Creation of a National Economic Council working group on digital assets, chaired by David Sacks.
2. Review of existing regulations within 30–60 days, followed by a report to the President in 180 days.
3. Consideration of a national digital asset reserve while explicitly prohibiting government action on (Central Bank Digital Currency) CBDCs.
U.S. BITCOIN RESERVE: REALITY CHECK
While the executive order affirms the administration’s pro-crypto stance, it stops short of immediately establishing a national Bitcoin reserve. If approved, the reserve would take shape in at least six months, delaying any near-term impact.
The working group may begin by utilizing seized cryptocurrency rather than purchasing new BTC. The U.S. government currently holds 198,000 BTC (~USD 20B, as of Feb 1) and USD 400M in other crypto assets.
For context, U.S. strategic reserves include: (a) Gold: 8,133 tonnes (~USD 737B as of 31/Jan), (b) Crude oil: 395M barrels (~USD 28B, as of 24/Jan), and (c) Foreign currency reserves: ~USD 239B (Q3 2024).
The U.S. gold reserve accounts for 3.8% of the total above-ground gold stock, while its Bitcoin holdings currently represent just 1% of the total supply. To match the gold reserve proportion, U.S. Bitcoin holdings would need to increase by 554,000 BTC, valued at approximately USD 55 billion at current prices. Over time, a Bitcoin reserve could realistically expand by USD 50 billion to USD 70 billion.
Meanwhile, several U.S. states are advancing their own Bitcoin reserve proposals. 15 states are considering BTC-related fiscal policies, with:
• Oklahoma, New Hampshire, Pennsylvania proposing 10% public fund allocations
• Texas suggesting a donation/tax model
• Arizona and Utah advancing legislation beyond committee stages
REGULATORY CERTAINTY FOR BANKS
Fed Chair Powell recently confirmed that banks can engage with crypto provided they manage associated risks. While this imposes stricter compliance requirements, it provides much-needed clarity following the post-FTX banking shakeout that shuttered major crypto-focussed banks.
Fund Flows: Institutional Demand Remains Strong
BTC ETFs saw record one-day inflows of over USD 1B on Trump’s inauguration eve. Since then, daily inflows have averaged USD 257M, with only one outflow day (-USD 457M on Jan 27).
Cumulative BTC ETF inflows since Jan 20 now total USD 2.3B, pushing assets under management (AUM) to nearly USD 118B.
Source: Arkham Intelligence
Notably, ETF investors remain highly profitable at current prices. Arkham Intelligence data shows IBIT ETF holders sitting on a 45% gain, which may limit immediate selling but could lead to some profit-taking.
MicroStrategy remains a major BTC buyer. The company recently completed a USD 584M perpetual convertible offering to acquire more BTC, potentially fuelling short-term upside.
TECHNICAL ANALYSIS & TRADE SETUP
BTC’s recent pullbacks have ranged from 10.1% to 23.6% Fibonacci levels, like the 2018 bull cycle according to Glassnode .
Source: Glassnode
The drawdown since reaching ATH on 20/Jan represents a ~13% move which suggests the drawdown is larger than usual ones during this cycle.
Historically, this phase of the bull run experiences FOMO-driven price acceleration, though long-term holders’ profit-taking presents a headwind.
BTC fell below the 50-day MA over the weekend, this level has served as support recently. The 92k level is also significant as it has provided support several times during recent retracements. However, in case the selloff deepens, the next significant support may be as far as the 100-day MA at 85k.
HYPOTHETICAL TRADE SETUP
BTC has outperformed equities amid macro uncertainty and is increasingly correlated with gold (30-day correlation: 0.67). Recent tariff announcement in the US has driven a sharp selloff.
Despite a less-than-ideal FOMC outcome, BTC retains several bullish drivers, supported by Regulatory optimism following Trump’s executive order, Fed Chair Powell’s statements on crypto banking, and Institutional & sovereign demand.
The recent selloff offers a tactical opportunity to build long positions during volatile drawdowns.
Investors can opt for the following hypothetical trade setup consisting of long position in CME Micro Bitcoin Futures expiring on 28/Feb (MBTG2025). Each contract of MBT provides exposure to 0.1 BTC and requires margin of USD 2,451 as of 31/Jan.
• Entry: 94,000
• Target: 100,585
• Stop Loss: 90,000
• Profit at Target: USD 659 ((100,585-94,000) x 0.1 BTC per contract)
• Loss at Stop: USD 400 ((90,000-94,000) x 0.1 BTC per contract)
• Reward-to-risk Ratio: 1.65x
CME Group lists a raft of products covering a range of asset classes more accessible while also enabling granular hedging for portfolio managers.
Portfolio managers can learn more on how to access these micro products by visiting CME Micro Products page on CME portal to discover micro-sized contracts to gain macro exposures.
TradingView has launched The Leap trading competition starting today. New and upcoming traders can hone and refine their trading skills, test their trading strategies, and feel the thrill of futures trading with a vibrant global community through this paper trading competition sponsored by CME Group using virtual money and real time prices. Click here to learn more.
MARKET DATA
CME Real-time Market Data helps identify trading set-ups and express market views better. If you have futures in your trading portfolio, you can check out on CME Group data plans available that suit your trading needs tradingview.com/cme .
DISCLAIMER
This case study is for educational purposes only and does not constitute investment recommendations or advice. Nor are they used to promote any specific products, or services.
Trading or investment ideas cited here are for illustration only, as an integral part of a case study to demonstrate the fundamental concepts in risk management or trading under the market scenarios being discussed. Please read the FULL DISCLAIMER the link to which is provided in our profile description.

Virtuals Protocol in Freefall Mode, Bounce Next?Virtuals Protocol www.tradingview.com has been in freefall since it cracked $5 a week ago. The good news? Currently Virtual is at $2.70, slowing down for a pit stop at a key support - the 50% Fibonacci retracement level. A strong bounce here (we would want to climb back up past $3) could mean the bulls have taken back control and we might be in for an exciting reversal! If that doesn't happen and the baby bears come correct $2.15 is the next key support level to keep an eye on. Do you think we'll get a second wave? Let us know if you are buying the dip!
.............
New video dropping today!
Follow us for more timely technicals updates!

ETH/USD Bullish Setup: $6,000 TargetA bullish inverse head and shoulders pattern is forming on ETH/USD. ETH appears to be approaching the completion of the right shoulder, which lies in the $2,800–$2,900 region. A solid buy position can be considered in this area. Continue buying the dips! The projected target for this pattern is around $6,000.

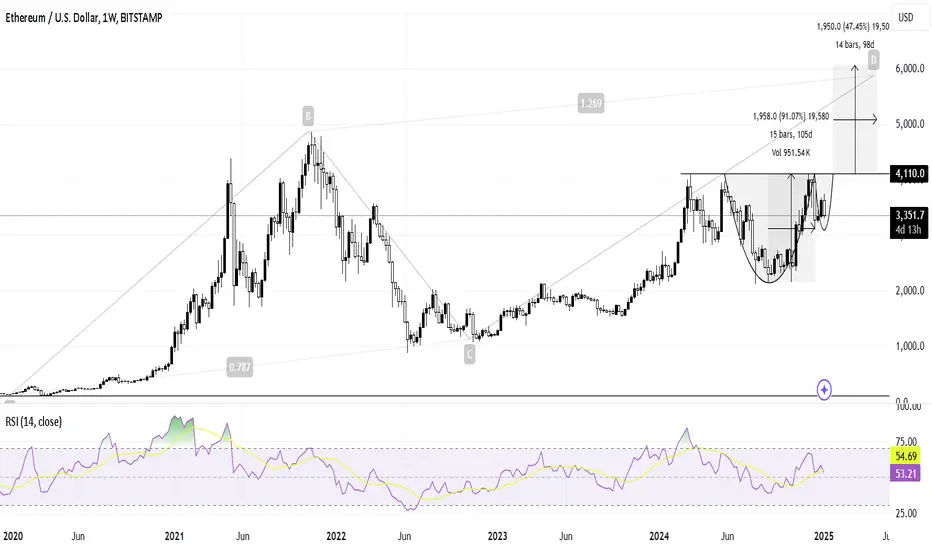
ETH Bullish Setup: Path to $6,000ETH is gearing up for a bull run!
Monthly Chart : An ABCD pattern indicates a price projection around $6,000.
Daily & Weekly Charts : A bullish continuation pattern (Cup and Handle) supports the same target of $6,000.
Strategy :
Buy the dip and hold.
Alternatively, wait for a breakout above $4,110 for confirmation.
NVDA – Buy the Dip for a Short BounceOur last NASDAQ:NVDA trade went very well. Within a few weeks we made more than 15% re-testing the ATH and generating a new one. Directly after hitting the ATH we saw a sell on good news event during the CES and the presentation of the “Home AI PC”. The perfect time to buy was yesterday minutes before markets closed. The price formed a falling wedge with a RSI divergence. Nevertheless, buying today could still give results. Target is the ATH again and invalidation point is a close below our $140 support.
Target Zones
$154
Support Zones
$140

Bitcoin Bullish 2024-2035 UPDATE. Mass Adoption ComingGood day to you all. My previously published idea Works Well. So there i an Update of That for ne Decade again.
A i posted in Previous Long-Term TA. We had a little time to accumulate more #Bitcoin before it break previous ATH at $65000. (Check Previously posted Scenario).
Our next Main targets still absolutely same at $335000 by ~2025y
Few stops at $125000 and $240-270000 have a chance to be... No matter stops
After that Bitcoin will go it's last time correction until $100000-125000. And again all of you will think it's dead and that all. But Governments will buy it all from you, moreover they'll buy from whales. Everyone will buy it before mass adoption will start... GLOBAL adoption. It will have a place near 2026-2028 years. So there will be you time to buy the dip. It will be shorter1-2 years to buy that dip.
Our next big Target after that at $1000000 and $1.8 Millions.
Timeframe 2028-2035yy. (l'Il update this TA again at some point). This is the Target where 95% of you thinks it will be a Big resistance, and, i think, everyone will leave the game at that Target, and their game will be over forever, it will be your Big mistake. At 1M price we'll see full adoption in our Earth life of #Bitcoin. They'll start to accept crypto everywhere. So there are zero reason to sell at $1000000, bcoz there are no more corrections like we saw in previuos waves and Seasons.
After That #Bitcoin will rise slowly going to $10000000. Do you own Research. But we now at stage where its a gold time to buy the dip at even $100000 price today.

DOGE - IT'S NOT OVER YET!!!What goes up, must come down. What goes down, must come up.
As above, so bellow. Yin Yang
Good/Bad
Keep calm.. relax, be greedy when others are fearful.
The dip will get eaten up, this is just a healthy pullback in the market that liquidated the greedy buyers who never learn with their long positions ;)

SOL Swing Trade: From $175 Support to $800 TargetIn this video, we revisit Solana's (SOL) price action, highlighting the progression toward our entry target of $100 as discussed in March. Now facing resistance at the previous all-time high (ATH), a pullback appears both healthy and likely. We'll analyze the potential for support levels to hold, with $175 being a key structural level. From there, Solana could chart a path to our profit targets: $500 for a 2x return and $800 for a 5x return. Join me as we explore strategic entry points, key levels, and market conditions driving SOL's performance, and discuss how to capitalize on this exciting opportunity for swing traders.

MOBILEYE ($MBLY) : BUY OR FOMO YOUR CHOICE! TICK TOCK!!!NASDAQ:MBLY BUY OR FOMO YOUR CHOICE!
In this video, we talk about:
1.) Why the stock is down 5%
2.) Why everything on the Technicals/ Fundamentals point to a STRONG BUY.
3.) My earnings prediction & fair value
Thanks for watching! I know it was a longer video, but I always want to be thorough. Especially with a name as polarized as this one.
Are you a BUYER, will you FOMO, or am I WRONG? Let me know in the comments.
YouTube:
@TheRonnieVShow
NFA
#BuyingOpportunity #BuyTheDip

Hooking the BigTime: Reeling in Profits Before the Tide Turns!💡 Overview :
This trade setup focuses on accumulation and distribution zones of BITGET:BIGTIMEUSDT.P identified through technical analysis, inflow/outflow metrics, open interest, and funding rates. Based on the data provided, we're targeting a strategic entry point during accumulation, a clear stop-loss level, and a take-profit level based on historical resistance. Let’s dive into the why , what , when , how , and where of this trade.
🐝 Why This Trade?
Accumulation Phase 🟢:
The accumulation zone between $0.10 and $0.12 is based on increased inflows (green bars) combined with strong support levels where buying pressure was historically dominant.
Long/Short Sentiment 📊:
A favorable long-short ratio around these levels signals traders expecting upward momentum, supporting the accumulation narrative.
Price Bounce Potential 🚀:
The charts indicate significant price rebounds after reaching this zone, supported by previous spikes in Open Interest and inflows, signaling that buyers are active here.
🐝 What’s the Plan?
We aim to enter the market within the accumulation zone between $0.10 and $0.12 and exit at a key distribution level of $0.15 for a calculated risk/reward trade.
🐝 When?
Entry Point 📈:
Enter the trade when the price touches or consolidates between $0.10 and $0.12 , confirming that accumulation is happening (evident by inflows outweighing outflows).
Exit Point 💰:
Exit when the price hits $0.15 , which aligns with a previous resistance level where heavy distribution and outflows were seen, suggesting a potential reversal.
🐝 How?
Risk Management Strategy 🔒:
Stop-Loss :
Place your stop-loss just below $0.10 to protect against downside risk in case the market fails to hold the accumulation zone.
Take Profit :
Set your take-profit level at $0.15 , which is the projected distribution zone , as prices have historically struggled to break past this level without major outflows.
🐝 Where are the Key Levels?
Accumulation Zone 🟢:
$0.10 - $0.12
Look for inflows > outflows and rising open interest to confirm accumulation.
Take Profit Level 🏆:
$0.15
Previous resistance and outflow spikes suggest this is a key distribution zone.
Stop-Loss 🛑:
Below $0.10
To protect against losses, use a tight stop-loss just below this level where strong support is expected.
🐝 Trade Summary 📝:
Entry : $0.10 - $0.12 (Accumulation Zone)
Take Profit : $0.15 (Distribution Level)
Stop-Loss : Below $0.10
📊 Indicators to Watch :
Long/Short Ratio : Favorable for longs near accumulation.
Net Inflows/Outflows : Inflows must exceed outflows in the accumulation phase.
Open Interest : Look for peaks to signal strong market activity before a potential breakout.
🚨 Final Thoughts :
This trade idea relies on well-established support at $0.10 - $0.12 and anticipates a rebound towards $0.15 , where distribution pressure might cause a reversal. Risk is managed with a stop-loss just below the accumulation zone, and profits are locked in at the $0.15 level.
Good luck! 🍀📈

Strategic Bitcoin Accumulation & Market Insights: October 2024
Current Price : INDEX:BTCUSD $61,898 🚀
---
1. Overview of Price and Market Dynamics
Price Action :
Bitcoin is trading at $61,898 , showcasing strong momentum. Market dynamics reflect a balance between whale accumulation 🐋 and short-term speculative movements 📊. The price has consolidated after breaking key support, with large holders dominating market activity.
---
2. Accumulation Zones 🛑
Whales have been steadily accumulating in the $55,000 - $58,000 range 🐋, signaling strong confidence in future price appreciation 📈. This zone will act as a significant support level in case of any pullbacks.
- Accumulation Zone : $55,000 - $58,000
- Observation : This zone has the highest concentration of buy orders, making it a critical support area.
---
3. Distribution Zones 📈
The primary resistance zone is located between $65,000 and $67,000 . Sell-side pressure is expected to increase as short-term traders take profits 💰. Watch for increased volatility in this zone.
- Distribution Zone : $65,000 - $67,000
- Observation : Significant resistance at this level could trigger a short-term pullback.
---
4. Accumulation Strategy 📊
Where :
The ideal accumulation range is between $58,000 - $60,000 , where whales are heavily positioned. Large holders are removing Bitcoin from exchanges and storing it in cold wallets 🧊.
When :
Accumulate during periods of low volatility. Exchange outflows indicate fewer people selling Bitcoin, providing a strong buy signal 🔥.
How :
Use a dollar-cost averaging (DCA) approach between $58,000 - $60,000 to mitigate volatility. Set stop-losses below $55,000 to protect your capital.
---
5. Distribution Strategy 💡
Where :
Consider selling around $65,000 - $67,000 , where strong resistance is expected 🛑. This area has previously seen significant sell orders, creating a potential distribution zone for traders.
When :
Look to distribute as Bitcoin nears the $65,000 resistance level. Failure to break this level will likely lead to a pullback 📉.
How :
Use limit sell orders slightly below $65,000 to maximize profits. Long-term holders can consider partial distribution to lock in gains while riding the next potential wave upward 🚀.
---
6. Whale Activity and On-Chain Metrics 🐋
Whales have been accumulating Bitcoin steadily between $55,000 - $58,000 . The reduced exchange inflows indicate large holders are moving assets off-exchange 🧊, preparing for a long-term hold. Unspent Transaction Outputs (UTXOs) have been increasing, further confirming long-term accumulation.
Actions :
- Accumulate with Whales : Buy within the whale accumulation zone between $58,000 - $60,000 .
- Monitor Exchange Inflows : Decreasing inflows are a bullish signal for future price appreciation.
---
7. Key Technical Indicators 📊
- Support : $55,000 - $58,000
- Resistance : $65,000 - $67,000
Volume :
Volume is building around the $58,000 - $60,000 range, indicating steady accumulation 📉.
RSI :
RSI is neutral, meaning Bitcoin is not yet overbought. Momentum is building for a potential breakout above $65,000 .
---
8. Derivatives and Open Interest Analysis 📈
Open Interest :
Bitcoin open interest remains elevated in futures markets, signaling heavy speculative activity. A potential price move above $65,000 could trigger liquidations 🚨.
Funding Rates :
Funding rates are neutral, meaning long and short positions are relatively balanced. This suggests that traders expect further price gains, but not extreme volatility.
---
9. Take Profit and Stop Loss Levels 📉
Take Profit Levels :
- $65,000 - $67,000 : Ideal take-profit zone for short-term traders 📈.
- $70,000 : Secondary take-profit target for those expecting a strong breakout.
Stop-Loss Levels :
- $55,000 : Place stop-losses just below this level if accumulating around $58,000 . This ensures capital protection in case of a downside move 📉.
---
10. Final Observations and Strategy Summary 🔍
Why :
Whale accumulation, decreasing exchange inflows, and strong on-chain activity suggest that Bitcoin is entering the final stages of accumulation. A breakout above $65,000 could drive prices toward $70,000 .
Where :
Focus on buying in the $58,000 - $60,000 range and aim to sell near $65,000 - $67,000 . Long-term holders should continue holding.
When :
Look for accumulation during periods of low volatility and outflows. Distribute near resistance zones and take profits at critical levels.
---
Strategic Actions :
1. Buy : Accumulate between $58,000 - $60,000 .
2. Sell : Take profits near $65,000 - $67,000 .
3. Hold : Long-term holders should maintain positions, as whale activity points to future upside 📊.

ADBE 9-EMA Dip BuyIn this video I go over the Adobe Stock coming back to the 9 Emma moving average. I'm looking for the price to come back a little bit and close just below or on the 9 EMA and then as soon as Thursday or Friday happens, I want to see the price go back above the 9 EMA and then buy to enter the position long. Adobe is considering a mega cap, and the mega caps are getting all the attention right now so make sure that if you play any large caps or mid-caps that you have a lot of conviction. Please realize that the money has not been flowing into large or mid cap stocks for quite some time so that's why I am focusing on the Mega CAPS.

Strategic Bitcoin Long Positions Amid Market FluctuationsHi everyone, so we had the dip, Bitcoin is lower, it came close to the 64,800 which was big support after the 66,200 was lost. But this is an entry for me, and I've been trying every step of the way to find support to go long.
You see, once you pick a direction, it's better to keep your direction, and if you're long, stick to long positions. We've attempted many long positions, and while some went into the middle, they provided opportunities to secure some profit or at least move the stop loss at entry. This could be the big one, and the targets I see are 67,000 and 68,700, which is the top of the channel, and then 71,860, which will be the third attempt.
We got rejected twice at that level, first in May and then on the 7th of June. I expect the third and crucial attempt to happen sometime this month. If that level is breached on the third attempt, we could skyrocket to 79,000 and even 80,600.
Nobody said it's easy, guys. Unlike last year when we bought from 16,000-18,000 and everything went well, we now have to navigate through more complex conditions. Although the Feds haven't cut rates yet, we have eased inflation and the Ethereum ETFs coming up, providing good reasons to expect Bitcoin to go back up higher.
The Nasdaq is at a new all-time high, and Bitcoin should follow. So I'll stick to the main structure and keep buying. If Bitcoin starts an epic rebound today, we could be heading towards 95,000.
Again: There is support now (very close) at 65,300, which was lost and regained very quickly, making it a trade with the stop loss just below that. In the worst-case scenario, 64,800 is still support.
I'm long here, and once you pick a direction, stick to it. It might be tiring, but it's essential to stay alive and be able to trade again. Spot trading is different, but for leverage trading, have a daily limit or budget in bullets. When the market fails but you see support or a good entry, buy in again and fight. We never die; we never go down, and we stick to one direction. It does work, and the analysis says Bitcoin long. That's what we do.
One Love,
The FXPROFESSOR 💙

GNOUSDT | Ready for Another Push Higher?Market Context
GNOUSDT has been on a roll with a significant push higher recently, and the momentum suggests we’re not done yet!
Strategy: Buy the Dip
To capitalize on this bullish trend, here’s our buy-the-dip strategy with precise limit orders:
LIMIT Order 1: 353.93 | TP: 389.45
LIMIT Order 2: 341.12 | TP: 352.96
LIMIT Order 3: 329.60 | TP: 340.70
Excitement Ahead
With these setups, we're positioned to ride the next wave up. This could be a thrilling ride, so buckle up and stay tuned!

POLYXUSDT | Testing the New Trading SystemMarket Context
Exciting times as we put our new trading system to the test with POLYXUSDT!
Strategy: Buy the Dip
We spotted a trendline break on the 5M chart and used adjusted Fibonacci levels to set up our limit orders. Here's the plan:
LIMIT Order 1: 0.5169 | TP: 0.5415
LIMIT Order 2: 0.5080 | TP: 0.5163
LIMIT Order 3: 0.5000 | TP: 0.5078
Results
We hit LIMIT #3 and secured a solid 2.53% gain! 🎉
This system is showing promise—let’s see how it continues to perform. Stay tuned for more updates and trades!

DKNG flushed and then went dry LONGDKNG is a solid large cap with great price action. Today it drained 5% and then put on the
stopper. Price reversed and stabilized in the afternoon session. The fall was to below the
second lower VWAP band in deep undervalued territory. I see this as a chance to pick up DNKG
at a 10-15% discount for a long trade. The dual time frame crossover of the faster line over
the slower line is reassuring bullish divergence enough for me to look for the best entry on
the lower time frame chart.

5 Waves Up On Total Crypto Market Cap.Hey everyone! It's Dalin here.
I am very excited to post this chart today as I expect a pullback in the markets.
Things looked bullish, but then everyone started buying the "news" associated with the ETF.
(The saying goes, "Buy the rumor, sell the news," not "buy the news.")
Patterns are bearish, with bearish divergence everywhere. There are five waves up in many cases. I expect a pullback here.
This means Bitcoin could fall by 30%, and many altcoins will get wrecked.
I am 50% in cash, ready to buy the dip. If you sell and buy the dip later, you can grow your portfolio significantly when it rises again.
That's all for now, folks.
Stay profitable,
Dalin Anderson

ARB ready to start it's Bull market?My opinion is ARB / Arbitrum is finishing it's major 2nd wave correction as an running flat and breaking the white downtrend line indicates that 3rd major wave is starting. How ever if the red scenario happens more possibility to invalid the whole bullish scenario rather than it's to be a expanded flat. Let's see. DYOR! Always invest what you can afford

NFLX is at the support of the POC line LONGNFLX on a 120 minute chart currently has price sitting on the POC line confluent with the
Fibonacci 0.5 level on the previous trend up that was before the trend down from around
the time of an earnings beat which was a disappointment because traders somehow expected
better. There is been some disappointment about NFLX keeping some of its subscriber trends
private. Not a surprise. Price has put in somewhat of an inverse head and shoulders or triple
bottom. The Lux Algo forecasting indicator expects a move up. I will take a long trade here.
I believe that this is a buyable dip.

ACB a MJ small cap set up LONG Aurora Cannabis on a 15 minute chart is sitting on the dynamic support of the second lower
VWAP band in deep undervalued territory also below the high volume area of the immediate
volume profile anchored back to April 11th. The Trend indicator shows bearish momentum has
bottomed. The dual time fram RSI indicator shows RS values in the low 40s. ACB did have some
bullish volume spikes throughout the previous session. Next weekend, is National MJ Day and
a bit celebratory for stocks in this subsector. The backdrop of legalization in Germany and the
ballot initiative in Florida both have relevance and importance. Vice President Harris is pushing
the legalization as an incumbent seeking to be re-elected. All of this helps in ACB's
fundamentals and projects for future growth.
I see an upside of 15% to the recent high pivot and potentially beyond that.
