Akerna $KERN Coming In That Buy Zone. Fresh IPO (kind of).Akerna coming into that buy zone. Stock IPOed (actually it was a SPAC) at around $11 after doing their last private placement at $10.21. As this is a recent IPO (of sorts) and a cannabis company, I expect this will eventually shake out at 2x the IPO price (around $20) so buy on dips.
Why 2x IPO price? Look at high flyers Zoom $ZM, Beyond Meat $BYND, Crowdstrike $CRWD, all trading at about 2x IPO price, based on hype, growing markets, and sales growth.
Akerna is Cloud + Payments + Cannabis. They have an ERP software for cannabis supply chain / growers / dispensaries. All the buzzwords. Not sure 100% if the company has a legit future (need to do more research), but certainly I think this thesis is enough to put it on your watchlist.
Buythedip

Bitcoin - Weekly update for Sunday June 30th 2019Good morning my fellow Bitcoinistas!
I know the weekly close is over 12 hours away but I wanted to go ahead and put out my weekly update so you have the information in advance. I'm going to try to keep this short, to the point, and just hit the high spots. I will add a link to last week's update for anybody not following my work that wants to see the previous updates and how deadly accurate they were. :0)
I think we close this week with a green candle, but it will be setting up next week for possibly a red candle. It seems we have exhausted our momentum for the time being and some technical issues need to be addressed before we go racing higher. To whit, there is still a CME Gap down around $8500 that is begging to get filled. Also, the 20 week Moving Average (orange dotted line) is begging for a test for support. The baby blue zero line of the Fib-Channel may need to prove its support one more time as well. Everyone is screaming to go higher, therefore it may be time for a pullback (psychology) etc. etc. In short, the market needs to take a break to satisfy multiple issues.
The good news? I don't think the pullback will last more than a few weeks if that long. It is only 3 weeks over to the 20 MA line, $8500 Gap, and baby blue trend line. A perfect trifecta! Does it have to take that long? No. We could have a flash crash today, next week, or anytime between now and the targets mentioned. It is not so important as to when the gap is filled, when the 20 MA is tested again, etc. Its just a matter that these things do happen.
For those of you following my posts you know I sold about 40% of my long position the last couple days to pay off the rest of the other 60% of my long position. My trip to the moon is currently FREE and I now have the cash to buy more carry-on luggage if the price is right. :0)
At any rate, let me wrap this up. I hope I didn't miss anything. If you study this chart for a minute I think you will see why we are going to pullback a bit. The long wick type candle forming this week, how it pierced the 0.236 Fib line and retreated, the gap that needs to be filled, support that needs to be retested. THE 40% CORRECTION everybody says we need, etc. All these conditions get met if we go down to at least the $8500 area. If we do see those prices, I don't think we will stay down there very long. Have your orders ready if you want to add more BTC because it may be the last good opportunity under $10K. (In your life time) I firmly believe this. Once these technical issues are satisfied the price will take off again. If people miss it they will lament about how they woulda, coulda, shoulda, backed up the truck on this next dip. But I say you're either ready or you're not. You either have a plan or you don't. For those who don't like to trade, now would be a good time to setup a dollar cost average plan. It's still a plan. Just buy x dollars per week, month, etc. and walk away. It doesn't get any easier than that and the future rewards could be tremendous IMO. The potential gains a year from now are ridiculous!
At any rate, these are just my thoughts and opinions, not advice. Everything could play out as I expect or none of it could even come close. Do your own research and study the charts, news, technical indicators, etc. etc. so you can make an informed decision on what steps you want to take next.
No matter how you play this crazy game I wish you the best of luck.
BBS out!


EOS ghost feed price prediction back to 8.50 USDbased on the ascending channel that EOS is creating along with it being the biggest loser of the day vs the US dollar, EOS is due for a rebound into another BART pattern upwards. See my ghost feed for an estimate price on the timeline on the 4hr chart. Buy the Dip now


wave patterns for MATIC next 5-10 days predicts bouncethe wave patterns I'm reading are already showing a slight bearish break out of our symmetrical triangle. If we lose 0.02 its not going to stop until we hit our next area of high trading activity between 0.010-0.015. buy around 0.0125 and when we return to the 0.02-0.025 range, profits will be immense as shown by price tool.

My custom gann trend lines says MATIC should drop soon!came up with this by combining a couple different techniques to find a range for a bottom. :)

long scalping for MATIC next 24 hours #buythedipentry and exit for today's next wave. entry somewhere around 0.02-0.022. Exit around 0.0275-0.03

Sawcruhteez Strategies: How to BUY THE DIP Disclaimer: If you are primarily interested in copying other people’s trades then this is not for you. However, if you are willing to put in the work that it takes to learn how to trade for yourself then you have found the right place! Nevertheless please be advised that you can give 10 people a profitable trading strategy and only 1-2 of them will be able to succeed long term. If you fall into the majority that tries and fails then I assume no responsibility for your losses. What you do with your $ is your business, what I do with my $ is my business.
Click here for my Comprehensive Trading Strategy | Click here for my Comprehensive Trading Process
Throughout the past six months I have been calling for a return to $1,000. I was convinced that $3,200 was not the bottom for a number of reasons and now it appears that I was sorely mistaken.
There are two types of mistakes when it comes to trading, ones that cost money and ones that cost opportunity. By not buying in during the first quarter of 2019 I missed out on some huge opportunity, but I didn’t cost myself any capital.
When close to the top or the bottom of a major market cycle it is very important be okay with missing out on opportunity. Many who bought sub $4,000 also bought when the price consolidated $6,000 and took a stop loss when it broke down. Many did the same at $7,500, $10,000 and $12,500.
After accounting for the losses, buying the bottom is often far less lucrative than it may seem. I was selling those prices and now I have the desirable opportunity of buying back in cheaper, eventhough it is far from the lowest prices of the quarter.
I believe that there is a 75% chance that the bottom is in.
That percentage will increase to 100% if we can put in a solid higher low above $6,200 and then a higher high above $8,200. Those chances are more than enough for me to start scaling in. If we do get a higher low / higher high then want to be fully entered.
Everyone tells you to “buy the dip” but most do not go on to explain how. I will be using a combination of Dollar Cost Averaging and dip buying in order to increase my exposure to Bitcoin. My full strategy along with multiple additional options are outlined in this two part post. The topics covered will be: Buying the Dip with Moving Averages, Buying the Dip with Trendlines and Fractals, Dollar Cost Average by Time, Dollar Cost Average by Price, Daily Dollar Cost Average, Psychology and Risk Management.
The first part will cover tactics for Buying the Dip
The second part will cover Advanced Dollar Cost Averaging
Both parts will touch on Risk Management and Psychology
Buying The Dip With Moving Averages
My preferred approach is using Exponential Moving Averages to scale into a dip when the asset is in a confirmed bull market. I also use EMA’s to determine the trend. If the 50 W EMA is moving up, with the price above, then it is a confirmed bull trend.
After determining that the trend is bullish I have decided to increase exposure. Now I will use the 50 and 200 EMA’s and zoom into the 1D and 4h charts in order to time my entries. Using those areas of support I will set Good-Until-Cancel Limit Orders.
In general I will do something along the lines of:
4h 50 EMA: 10%
4h 200 EMA: 20%
1D 50 EMA: 30%
1D 200 EMA: 40%
4h EMA DCA
1d EMA’s
As price decreases I increase the exposure and improve the cost basis. Ideally the price will spend very little time below the 50 Day EMA. Instead I would want to see a sharp bounce from the 200 EMA and a close back above the 50 EMA.
If the price spends much time below the 50 Day EMA then it will roll over and there would be a large risk of a death cross.
When buying the dip using EMA’s I do not like having a set stop loss on the books, in the event of a spike low that would wipe me out right before the bounce. Instead I will use the death cross as my stop loss, as well as a potential area to flip my position and go short.
This is why it is important for the price to rebound sharply after testing the daily EMA’s for support. This is less likely when the EMA’s have only recently crossed and have not established a proven trend.
Recently crossed EMA’s are the first sign of a reversal, they are too immature to be considered an established trend. Therefore I will be quick to exit my position if the price struggles to stay above the 50 and 200 Day EMA’s, which currently waits in the $5,000 neighborhood.
Do not assume that the Moving Averages that I use are the best. Different durations should be used for different assets and different time frames. In general higher volatility calls for shorter term MA’s or EMA’s and shorter time frames do as well.
I prefer Exponential Moving Averages because I have found that they are better at identifying areas of support and resistance and they also tend to provide less false signals than Simple Moving Averages.
To learn more about using Moving Averages to signal entries / exits and identify areas of support and resistance refer to:
Deep Dive Into Consensio with Tyler Jenks
Confirm Entries with Horizontals and TL’s
As always it is important to confirm entries with other indicators. My favorite indicators for buying dips are Exponential Moving Averages, Horizontal Support, and Trend Support. When those are all in confluence then it represents a low risk, high probability opportunity to buy the dip.
It is quite common that those areas of support line up with one another. If the price is in a confirmed bull trend then the EMA will be trending up with the price above. There will often be a trendline that is established from the higher lows that is near to the EMA.
There are currently a number of trendlines that can be drawn on BTC and we notice that the 200 EMA on the 4h chart is slithering right in between two of them. The 200 Day EMA is doing something very similar with the two lower trendlines.
This is exactly what I like to see. It shows that we are in a strong trend and that there will be a ton of support waiting on a pullback. What is even more important than trendlines is areas of horizontal support. These can be drawn using prior areas of horizontal resistance. I strongly prefer using the weekly chart when drawing horizontals because the important price points usually become much more clear.
As we can see the buy areas identified by the 50 and 200 EMA’s on the 4h chart and Daily line up exactly with areas of prior support and resistance. This is very important confirmation for me when I plan on Buying the Dip Using Moving Averages .
If the entries are not in line with horizontals then I will make adjustments to my orders or pass on the entry entirely. Seeing a confluence of demand is very important to me and I will always use Trendlines and Horizontals to confirm entries signaled by the Moving Averages.
Let’s consider the entry price if price pulls back to $5,000 and all of the orders get filled.
Assuming that I have $10,000 that I want to enter on this dip:
30% at $5,800
40% at $5,100
20% at $6,200
10% at $7,250
Average price = $5,681
The gameplan would be to exit if the 50 and 200 Day EMA’s do not support the price and instead get a death cross. That would need to happen with the price below $5,000 and I would expect to exit in the $4,800 neighborhood. That provides a 15.5% risk. This would be done with the assumption that we are entering the next bull market and the upside provides a risk:reward ratio that is good as it will ever get.
However, keep in mind that the numbers outlined above will change every day. The EMA’s are moving up every day that the price moves up. Therefore the entries prices are slowly getting worse and the risk is slowly increasing. Furthermore the $4,800 exit is only a projection and with the volatility in BTC anything can happen before the EMA’s recross. Therefore it is extremely important to fully understand the risks of employing this approach.
This is an important concept to be aware of. Many people will target a specific price when looking to buy a dip. In reality the price that one should be willing to pay on a dip should increase as the price continues trending up.
Buying the Dip Using Trendlines And Bill Williams Fractals
Many people are not comfortable with the approach outlined above. I was recently on Tone Vays podcast and he objected to the idea of leaving a Good-Until-Cancel Limit Order on the books to buy a dip. His perspective is perfectly valid and goes to show how there are different strokes for different folks.
The approach outlined below is for individuals who prefer to wait for more confirmation of a reversal, following a dip in price, opposed to leaving open orders on the books. This approach is also preferable for individuals who like using set stop losses which provides a more defined risk parameter.
A very simple and effective way to identify bull markets is with a bull trendline. As long as price is making higher lows then there should be a best fit trendline that can be drawn to identify areas of support.
When price creates a higher high and then pulls back towards a trendline it can represent a great opportunity to establish / increase long exposure. This is usually a lot easier said than done, as is often the case with trading. One of the best ways I have found to time entries when the price is at / near a trendline is with Bill Williams Fractals . Fractals below the price are referred to as down fractals and it is a five candlestick pattern which occurs with the lowest low in the middle and two higher lows on either side.
A more aggressive approach only uses three candles, with the low in the middle and two higher lows that surround it. This is another tool that is very simple and can be very effective when combined with trendlines. It provides confirmation that the trendline held as support and that the price is ready to go higher.
It also provides a great area for a stop loss, especially on higher time frames. If a down fractal gets violated, even for a moment, then it provides strong confirmation that the trend(line) is broken and therefore a stop loss is warranted.
In crypto there are many stop runs and traps. Even those generally fail to violate fractals on the higher time frames, and that is why I think they are a great way to set and trail stop losses. When getting a fractal near a trendline I will look to enter on the second candle following the low, if it trades above the previous candle at any point.
This can be done with a Stop Buy Order that is placed right above the high of the first candle that follows the low. This could also be executed with a manual market order as soon as the entry is confirmed. Either way a stop loss should be immediately entered right below the newly printed down fractal. That stop loss stays in place until it is triggered or a new down fractal is established. The stop loss should be trailed just below the new fractal, as soon as it prints on the chart. This is done as a way to keep you in trades that are moving in the desired direction and to immediately exit at the first significant sign of a reversal.
If a down fractal is taken out then that generally will represent an established lower low. If that happens on the daily chart then it can often be a good time to exit long exposure and wait to see what happens on the correction. That is especially true on the weekly chart.
These entries can also be confirmed with the TD Sequential. If you get a down fractal following a trendline test then a slightly more conservative approach would be to wait for a green 2 trading above a green 1 before entering. This provides further confirmation that the swing low is in and that the price is ready to continue the previous bull trend.
This will usually get a worse price than entering on the final candle of the Bill Williams Fractal, however it will often provide a higher probability entry. It is up to individuals to decide for themselves if they prefer going for the best price, or the highest strike rate.
When looking at two very viable options I always prefer to go with some sort of combination. If looking to enter X then I believe the optimal strategy is to use the fractal to enter 1/2X and the TD Sequential to enter the other 1/2X. This means I will only be fully entered when the price is moving in my favor and will also limit my exposure / risk when price moves against the first entry.
Those are my two preferred methods for Buying the Dip . I find them to be very effective and most important they are approaches that I can trust in the heat of the moment. It will take time and experience to gain trust for any trading technique, that is why I always strongly encourage people to start small, but think big.
Eventhough I have learned to trust my dip buying tactics, I still do not employ that approach exclusively. For a number of reasons, primarily psychological, I prefer to compliment my dip buying with consistent Dollar Cost Averaging. This helps to alleviate anxiety when the market is running away from me and is a great way to remain patient while waiting for a dip that seems like it may never come. Furthermore it is a good way to hedge myself and ensure that I am increasing exposure if the dip I am expecting never does come, or if it doesn't come down as far as I'm expecting. Those topics will be covered in depth in the next post titled - Sawcruhteez Strategies: Advanced Dollar Cost Averaging.

BTC 4hr H&S call - for the cloutWatching to see if this plays out. Nice way to then fill the CME gaps:
Looking to buy all dips above 4900

$DVLP is our new 1-cent cannabis play w/ +800pct in revenue...=====================================
DVLP (Golden Developing Solutions Inc.)
Alert Price: $0.0168
Website | Recent News
=======================
Members,
We hope you enjoyed the long weekend, and took time for some much needed rest.
We've used our time wisely, and scanned the market for the next monster breakout trade.
One company that caught our attention was DVLP (Golden Developing Solutions Inc.).
Trading at just over a penny per share, this emerging leader in the Cannabis, Hemp, and CBD marketplace has more upside than most companies operating in the sector.
DVLP recently announced that, along with its recent acquisition, Infusionz, LLC (“CBD Infusionz”), that the two business entities have combined to achieve a record $590,488 in monthly revenues during March 2019, representing a massive 800% jump in combined performance on a year-over-year basis when compared to March 2018!
We did the quick math, and if DVLP were to continue this monthly revenue trend, annual revenues would equate to over $7M!
We can't think of any companies generating over $7M per year that are trading at just around 1-cent per share, which leads us to believe that DVLP is one of the most undervalued companies in the cannabis space.
This could be your perfect entry point for DVLP.
DVLP has a history of experiencing significant volatility.
In March DVLP traded as low as 0.0143, subsequently rallying to a high of 0.0269, an upside of more than 88% in just a few weeks.
Last week, we watched shares of DVLP run over +32% from $0.0177 to $0.0235.
Since this massive rally DVLP has consolidated back to its Thursday close of 0.0168.
DVLP appears to have found support here, and we believe that the next rally upwards to 2-cents, and beyond is about to take place!
That being said,we ask that you start your research now, and consider building a position in DVLP tomorrow morning at 9:30AM EST!
About Golden Developing Solutions, Inc.
Golden Developing Solutions (DVLP) is developing an online retail business for cannabidiol (CBD), hemp oil and health/wellness-related products. The Company is also developing a high-capacity, high-quality CBD extraction and production facility. In addition, through the website of its joint venture partner, Pura Vida Vitamins (www.PuraVidaVitamins.com), as well as through wholesale and distribution channels, the Company offers a broad range of high-quality, price-competitive products, including traditional vitamins, supplements, and CBD-based tinctures, vapes and soft gels, among other products. Merchandise also includes hemp and CBD-related products and additional products focusing on health and lifestyle.
Golden Developing Solutions is a development-stage company providing business services and/or products supporting the cannabis industry, in which company intends to make acquisitions in the near future. Currently, 29 states and the District of Columbia have passed laws permitting their citizens to use cannabis for medical and/or recreational purposes. Cannabis has shown encouraging signs as a treatment for various medical conditions and has become increasingly more acceptable to the public and society.
DVLP experienced a remarkable 2018, as the company noted in this announcement:
“Golden Developing Solutions Announces Nationwide Expansion of 'Where's Weed' Following Record Breaking $18 Million in Transactions”
A little about this platform:
“Since 2011, Where’s Weed has been dedicated to helping medical and recreational consumers find dispensaries, delivery services, strains, and deals in their local cannabis community.”
“Additionally, the platform helps cannabis companies connect with consumers and more efficiently manage and market their business in the digital space.”
Furthermore, the company announced:
“Golden Developing Solutions Announces 149% Q4 Rev Growth in “Where’s Weed” Division, Sees Accelerating Platform Growth in Q1 and 2019”
DVLP Acquires CBD Infusionz
DVLP secured powerful traction in the cannabis space as a service provider with their popular Where’s Weed app and portal. And, recently, they expanded this market coverage footprint by moving into the CBD space full force with their Where’s CBD portal, which is beginning to take root as a powerful resource.
That sets the stage for what they feel could be a true gamechanger in the quarters ahead, in terms of synergies and overall augmentation of their core growth proposition: their recent acquisition of Infusionz, LLC (“CBD Infusionz”), a premium manufacturer of high quality CBD products.
Why do they believe this acquisition is such an important move?
First off, it will immediately augment their topline growth data, which is a core factor for institutional investors in search of strong growth potential. They can now offer a better argument given the strong revenues they assume as we onboard CBD Infusionz. For example, if they backdate our analysis, the combined entity would have had total sales of more than $500K in February alone.
In addition, following this acquisition, they have a fully developed retail, wholesale, distribution, and white labeling operation in the CBD space to augment their Where’s CBD services offering.
In fact, with CBD Infusionz operationally integrated, they will now have on offer more than 150 product SKU’s, including vegan products, pet products, pre-rolls, concentrates, creams and lotions, muscle freeze, massage oil, and premium products with existing brand traction such as the Saucy Boss Concentrate line and the Terpy J Pre-roll line.
In short, they emerge from this deal with a powerful value proposition for new investment capital. Their equity is now trading at just 2X our 2019 projected sales, which represents a run rate of $6 million on an annualized basis at current levels. That run rate is also a fixed point on a steep growth curve that shows evidence of a 4-6 month doubling rate at present.
And, perhaps most importantly, they are tethered to arguably the two most robust growth markets on the planet right now in cannabis and CBD. Following this acquisition, they are now more focused on CBD than we have been in the past because the growth curve is even more robust in CBD than it is in cannabis, given the lack of legal barriers to mainstream adoption by consumers in North America. Recent updated forecasts now anticipate a twenty-fold ramp in total sales volume over the next 36 months in the CBD marketplace to over $20 billion, according to several prominent forecasts.
In other words, we believe, with their recent acquisition of CBD Infusionz, they have assembled the pieces of a very strong shareholder value proposition over coming quarters and years.
They will continue to act according to the principles that have taken them this far. They have a number of exciting plans in the works, and they will do their best to keep you updated as they move forward.
Recent Developments
Golden Developing Solutions Reports Record 800% Jump in Combined-Entity Revenues for March 2019
DENVER, April 15, 2019 (GLOBE NEWSWIRE) -- via OTC PR WIRE -- Golden Developing Solutions, Inc. (DVLP) (“DVLP” or the “Company”), an emerging leader in the Cannabis, Hemp, and CBD marketplace, is excited to announce, along with its recent acquisition, Infusionz, LLC (“CBD Infusionz”), that the two business entities have combined to achieve a record $590,488 in monthly revenues during March 2019, representing a massive 800% jump in combined performance on a year-over-year basis when compared to March 2018.
“We are seeing tremendous validation on a strategic level,” commented DVLP CEO Stavros Triant. “The move to expand our exposure to the CBD space was very well-timed, and is already beginning to pay off. The numbers for March bear that out unmistakably.”
Management notes that this data demonstrate a dramatic growth curve on both an annual and sequential monthly basis, with the comparative March monthly year-over-year and the sequential monthly data showing appreciable growth. As noted above, the year-over-year monthly comparable revenue data increased by 800% while the sequential monthly data showed an increase of nearly 18%, which represents a follow-on annualized growth rate of 630% over the coming 12 months.
According to recent macro analysis of the CBD space, that level of growth is not particularly remarkable given the market context. Analysts have begun to project similar exponential growth in the CBD space over the next 36 months following the signing of the 2018 Farm Bill, which opened the door to a much easier path of mainstream expansion in hemp-based CBD sales in the United States.
“As we integrate CBD Infusionz, we will be dramatically increasing our operational potential,” continued Mr. Triant. “Where’s Weed and Where’s CBD have provided powerful growth catalysts on the services side. But the addition of a true leadership asset on the CBD product side sharply amplifies our growth proposition at an ideal time from an industry standpoint.”
Market Outlook:
Growth of “consumer spending on legal cannabis” is expected to “accelerate in 2019, jumping 38% to $16.9 billion."
This number is expected “to reach $31.3 billion in 2022”.
But the US could provide the sector with an even bigger opportunity.
According to Business Insider, “recreational marijuana is now legal in 10 states; medical marijuana is legal in 33.”
But here is where this gets exciting for the sector, and why there has been so much enthusiasm recently…
According to MarketWatch, members of the US Congress plan to pass a Marijuana Banking Bill in 2019.
This could be another positive catalyst for the sector in the US as regulations further ease.
The movement is gaining traction too…
The “New Marijuana Banking Bill In Congress Has 108 Cosponsors”.
In fact, in a huge development, two weeks ago it was reported by Forbes: “Marijuana Banking Bill Approved By Congressional Committee”
This could be another massively positive catalyst for companies in this sector in the world’s largest economy.
Technical Analysis
DVLP has historic volatility, and has reversed hard off these levels time and time again.
It is also trading just slightly above its 52-week low, which leads us to believe that its upside potential far outweighs its downside risk.
In fact, a run back to its 52-week high of $0.14 from today's alert price would net traders over +733% in pure profit!
The Bottom Line
With growing revenues, and a solid plan for growth, DVLP appears to be grossly undervalued at its current share price.
Those who grab up shares at these levels could be handsomely rewarded in the immediate future.
That being said, we ask that all members start their research on DVLP immediately, and consider building a position tomorrow morning at 9:30AM EST
(*Remember to use a Stop-Loss Order or basic Limit Order to protect your gains, as well as limit possible losses.)
Best Regards,
The PennyStock101 Team
Don't Miss Our Next Huge Winner...
Text 'PS101' to '67076'
to have our Trade Alerts
Delivered Direct
to your Cell Phone.
(There is no charge.
Msg&data rates may apply.)
DISCLAIMER
This newsletter is a paid advertisement, not a recommendation nor an offer to buy or sell securities. This newsletter is owned, operated and edited by both MJ Capital, LLC and PennyStockLocks, LLC. Any wording found in this e-mail or disclaimer referencing to “I” or “we” or “our” refers to MJ Capital, LLC and PennyStockLocks, LLC. Our business model is to be financially compensated to market and promote small public companies. By reading our newsletter and our website you agree to the terms of our disclaimer, which are subject to change at any time. We are not registered or licensed in any jurisdiction whatsoever to provide investing advice or anything of an advisory or consultancy nature, and are therefore are unqualified to give investment recommendations. Always do your own research and consult with a licensed investment professional before investing. This communication is never to be used as the basis of making investment decisions, and is for entertainment purposes only. At most, this communication should serve only as a starting point to do your own research and consult with a licensed professional regarding the companies profiled and discussed. Conduct your own research. Companies with low price per share are speculative and carry a high degree of risk, so only invest what you can afford to lose. By using our service you agree not to hold our site, its editor’s, owners, or staff liable for any damages, financial or otherwise, that may occur due to any action you may take based on the information contained within our newsletters or on our website.
We do not advise any reader take any specific action. Losses can be larger than expected if the company experiences any problems with liquidity or wide spreads. Our website and newsletter are for entertainment purposes only. Never invest purely based on our alerts. Gains mentioned in our newsletter and on our website may be based on end-of-day or intraday data. This publication and their owners and affiliates may hold positions in the securities mentioned in our alerts, which we may sell at any time without notice to our subscribers, which may have a negative impact on share prices. If we own any shares we will list the information relevant to the stock and number of shares here. MJ Capital does NOT own any shares of the companies mentioned herewithin, nor intends to buy any in the future.
MJ Capital’s business model is to receive financial compensation to promote public companies. We have been compensated ten thousand dollars by One 22 Media LLC to conduct investor relations advertising and marketing for DVLP. Any compensation is a major conflict of interest in our ability to be unbiased. Therefore, this communication should be viewed as a commercial advertisement only. We have not investigated the background of the hiring third party or parties. The third party, profiled company, or their affiliates likely wish to liquidate shares of the profiled company at or near the time you receive this communication, which has the potential to hurt share prices. Any non-compensated alerts are purely for the purpose of expanding our database for the benefit of our future financially compensated investor relations efforts. Frequently companies profiled in our alerts may experience a large increase in volume and share price during the course of investor relations marketing, which may end as soon as the investor relations marketing ceases. The investor relations marketing may be as brief as one day, after which a large decrease in volume and share price is likely to occur. Our emails may contain forward looking statements, which are not guaranteed to materialize due to a variety of factors.
We do not guarantee the timeliness, accuracy, or completeness of the information on our site or in our newsletters. The information in our email newsletters and on our website is believed to be accurate and correct, but has not been independently verified and is not guaranteed to be correct. The information is collected from public sources, such as the profiled company’s website and press releases, but is not researched or verified in any way whatsoever to ensure the publicly available information is correct. Furthermore, MJ Capital often employs independent contractor writers who may make errors when researching information and preparing these communications regarding profiled companies. Independent writers’ works are double-checked and verified before publication, but it is certainly possible for errors or omissions to take place during editing of independent contractor writer’s communications regarding the profiled company(s). You should assume all information in all of our communications is incorrect until you personally verify the information, and again are encouraged to never invest based on the information contained in our written communications. The information in our disclaimers is subject to change at any time without notice.

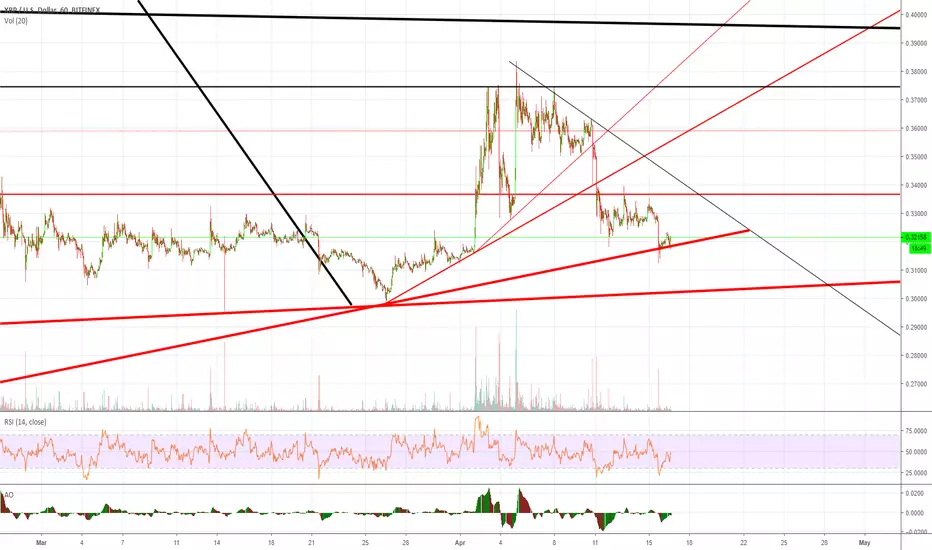
"Markets can remain irrational longer than you can stay solvent"It appears the XRP bears are determined to test XRP HODLers commitment to their bags. I personally made another purchase when I woke up to prices below the trend line which the price is now relying on as support. For the life of me, I'll never understand how anyone could ignore how unfathomably underpriced XRP is, as the crypto-currency most likely to become the IMF's first cryptographically validated digital currency. With rumors surrounding recent IMF announcements now suggesting XRP is on track to becoming the next world reserve currency, there's a serious disconnect between XRP's current market cap of less than $14 billion and the very real future of XRP facilitating the cross-boarder movement of 10s of TRILLIONS of dollars. In other words, XRP's current market cap is less than 1/1000th the volume Ripple is currently courting access to. Again to be clear, 10s of trillions is denoting the collective volume of Ripple's CURRENT partners, not rumored/potential future partners.
To anyone who understands the relation between market cap and 24/h volume, it's not hard to draw the conclusion that XRP isn't just 1/1,000th under-valued. It's likely 1/10,000th under-valued today, based upon current partnerships. A network which gains ~3 new partners every week. So every week XRP sits at this price range, is another week it becomes further undervalued. So needless to say I could care less how much long price is suppressed for, it just boggles the mind that I've been given the opportunity to buy XRP so cheap, compared to it's utility value, I've given up all life's vices and pleasures to dump my entire life's earnings over the last 8 months into this asset. Why? Because I know once banks get the lead out of their systems, they'll make me a billionaire. With or without new speculative volume entering the market between now and then. But because I feel grateful in this opportunity, I also feel compelled to share it. Why? Because I know my current bags will make me at least a centi-millionaire in no more than 10 years time.
Most likely far sooner than that. But I'm not here to convince anyone this is a get rich quick scheme, because if you think of XRP (or any other digital asset as such) YOU WILL GET REKT. To clarify, BTC has existed for 10 years. But the vast majority of it's growth can be distilled to 30 days. That's 120 days in the red, for one day in the green. So even on average, you'll be holding for 4 months before you see a single percent gain. Good luck getting rich quick. The only people who get RICH in crypto, are those with the HODL mentality. Those who buy dips and HODL in anticipation of the inevitable, yet still mystical green day.
KR bullish swingKR great volume today, bouncing off the 100 SMA on the monthly chart with tweezer bottoms. Looking for a limit buy on a retrace of this long day bullish candle.

BTC Update! Another leg down but bulls respond!Bulls finally trying to defend today. Last couple charts have been on weekly time frame where we were watching to see if bulls could break to a higher high on weekly. They failed and made the lower high up at $4189 before the pretty dramatic sell off a few days ago.
Originally I was watching for a lower high in the low $4000's and then a fall to somewhere between $3600-3800. The quick fall to $3712 in a few hours had me very cautious that the bears were not done and was then expecting a slow few days before bears potentially dumped price again. We finally got the second leg down today where price fell from low $3800's to $3655. Positive is the bulls have bought that dip relatively well to bounce price back up towards $3800 as of this post.
I am now on daily time frame watching to see if bulls can build that buying volume and establish $3655 as the higher low we have been seeking for on the weekly chart. Still too early to tell but do like the fact the bulls woke up today and bought price back up.
Not pictured but if looking at 4 hour chart, watch the EMAs as 12 EMA has been solid resistance since we peaked at $4189 a few days ago. Bulls have rejected from this EMA 5-6 times now on the 4 hour time frame. A push above there with some bullish volume will help to confirm bulls are keeping the weekly chart within a healthy equilibrium. Another rejection and bears dropping price back down and the concern shifts to bulls running out of space to maintain a healthy higher low on weekly chart.
Again, I am heading out of town for several days so won't be back on charts until next week. Protect that capital, trade with patience.
Just My 2 Sats!

$KO | #CocaCola looks like a BUY here! Sitting on MAJOR SUPPORT!$KO | #CocaCola looks like a BUY here! Sitting on MAJOR SUPPORT!

200 EMA AAPL Buying OpportunityAmid the downgrade to sales beginning of the month I still like this name, especially how it is reacting around 200 EMA, good time to pick up at this low price..

BTC Update! Bear flag break and strong dip buying!Leaving same 4 hour chart from yesterday here and if you actually zoom in on smaller time frame (5-15 minutes) it is much clearer. But yesterday we were watching for a potential bear flag as well as watching our 12 EMA serve as resistance.
The bears made an initial bear break but overall was fairly weak and a fairly quick recovery by the bulls to buy things back up. Bulls were again rejected by the 12 EMA tho and then the real bear break began where the bears crashed through some prior lows. Bulls did give an extremely strong buying of the dip and this bear break lasted all of 5-10 minutes going down to $3425 before rebounding. Bulls made a decent attempt here to break to a new high for the past 48 hours and go ahead of 12 EMA and tried to get ahead of 26 EMA as well. Currently bears have stepped back in but bulls fighting to maintain 12 EMA as support here which would be great news if they managed to pull that off. Zooming out towards daily and bulls have anything under $3766 is just another lower high. $3425 is currently our lower low on the daily as the bears seek to stair step the price action back down towards $3k.
While I am not excited to jump into a bullish position, I am happy to see the bulls not just rolling over and letting the bears take full control. Bulls are stepping in to buy these dips but if they continue to only set lower highs and then lower lows on our daily, it just becomes a matter of time before the bears make their big push. So stay cautious, if anyone played the dip buy early this morning, it gave a nice 4-4.5% return in minutes.
Just My 2 Sats!

PCG = REKTA perfect "Buy When There's Blood In The Streets" opportunity? I mean what's going to happen. Residential, commercial, industrial, and agricultural customers in Northern and Central California will no longer be using electricity and natural gas?

NASDAQ play update: 5.8k-6.5k? shortterm bull $nq1! $ndx $tqqqIt's late so I'm throwing this up quickly before market open. I'll update it later. My last chart worked out perfectly, we bounced off of a 0.5 retracement from 3.9k in early febuary 2016. I think we have at least 1-2 more days of upside on NASDAQ. My zones are defined on the chart. We bounced exactly on my teal support zone as predicted in my last Nasdaq chart, and I sold off some 12/28 TQQQ contracts at 3:55pm near at the height of the bounce.
In afterhours we're currently Bull flagging, probably getting to the .236 fib retracement around 6150. I'll be going long in the morning in anticipation of further upside, but I have a strong main objective to get a good short position on 1 of the indexes after this short squeeze rally. NASDAQ has been the hardest to push down during the past months, and it clearly bounced the highest yesterday 12/26. So I may look to the Russel and the S&P to short since they've been more bearish and I believe we have more downside over the next year.

Let's have some fun with Bitcoin ! #toomuchstupidtargetsoutthereHope this idea will inspire some of you !
Don't forget to hit the like/follow button if you feel like this post deserves it ;)
That's the best way to support me and help pushing this content to other users.
Kindly,
Phil

BTC/USD Possible MovementThe deeper BTC goes, the closer is the next bullrun. However, there are two possible variants that I can see.
1) The Blue One(Most Possible). BTC goes to 4900-5000 zone, where people open a lot of longs, expecting a breakout of the trendline. But it turns out to be fake, and we fall again to 3600-3850 zone.
2) The Red One(Alternative). BTC goes to the 4900-5000 zone, breaks it with high volume and the next TO THE MOON begins.
P.s. the time will show, I am in LONG right now, expecting the test of the mentioned zone.

BUY signal on #IWM #trading #stocksinvestingMy custom built "Buy the dip" indicator printed another buy signal after today's pin candle on key support.
Time to go LONG.

I'm for the BULLS!Watching BTC to see how we react off of this old channel top again...(If we drop!) Critical Breakout point. Should see solid support in green zone. We could still truncate into middle, and capitulation or more down is still a real threat until we are confirmed Bull Market. WE ARE SO CLOSE!
Which arrow do you think is coming?
