Buy the dip on #JNJMy custom built "buy the dip" indicator started to give BUY signals on #JNJ a few days ago; factor confluence was given by the gap closure (see yellow box) where price action printed a neat bullish outside reversal candle at key support level.
Got in @ $130.65 and still riding
Buythedip

Bitcoin Pulls Back - Time to Buy the DipFrom 24 June to 24 July, the Bitcoin price increased by almost 50%. That's an impressive move in anyone's books, so it was always likely that the bulls would need to take a breather at some point.
Personally, I expected this to come around $7500 mark, but instead the price broke through this level to trade as high as $8500. This move through $7500 was also a break of a head and shoulders pattern as illustrated in the graph with the neckline in pink. However, this initial impulsive move soon ran out of steam and after some sideways action we saw a sharp sell-off back to $7500.
As can be seen $7500 is a key level - it was broken after being tested a couple times on the way up and now I expect it to act as support on the way down.
Reasons to believe that $7500 will hold as support:
- Blue line is a long term trendline which was broken and now acts a support
- Pink line is the head & shoulders neckline extended which now acts as support
- The 0.382 Fibonacci level is a high probability turning point for a short term correction in a bull run
- The RSI is oversold on the 4 hour chart (red circle) indicating that the market is oversold
All of these factors are converging in the area highlighted by the green oval. Technically, we remain in a bull trend as long as we hold above this level.
Taking this all into account, I have entered into a long trade:
Entry - $7500
Stop loss - $7175 (set as a break below the right shoulder)
Take profit - $8320 (close to a retest of previous highs)
Risk/ reward ratio - 1 : 2.5
A risk/ reward ratio of 1 : 2.5 means that for every $1 I risk in the event I am wrong, I can potentially make $2.5 if I am right.
If we break below the right shoulder, then that means that the price has made a lower high and a lower. This signals a continuation of the macro bear trend and invalidates this rally as the start of a new bull market. Don't get caught long if this scenario plays out.
Remember that the goal of trading is to minimise your losses when you are wrong and to maximise your gains when you are right.
Happy trading!

16 risk/reward ratio trade for BTC!We are coming to 0.382 fib level of a very strong impulse which can qualify as wave 3.The 0.382 level is the most common level for wave 4 with respect for wave 3. Moreover, there is structural support from previous resistance there which would act as support now. A tight stop loss is advised for the initial buy.
We can project the wave 5 target from wave 3 which comes to around the 9000 level region which is almost 20% from where we stand now.

TESLA , BUY THE DIP! (BTFD) + SHORT POSITION !TSLA Stock has lost more than 9% in two sessions after second-quarter deliveries fell short even as company met a key production goal.

Possible Bear ScenarioPossible scenario I've worked out for XBTUSD where the remaining "weak hands" get shaken out. Many in the community have felt that 5800ish would be the last true "bottom" before where start the new bull run. I feel this analysis fits that narrative pretty well. As shown price appears to be in a channel similar to that of 05/28-06/09 which led to a breakdown of about 16-17% of price; if history were to repeat here we'd have the move down required to reach the price point of ~ $5800.
Furthermore with all the bullish news recently regarding Tether, ETC being added to Coinbase (which to me would signal an increase in liquidity and demand for BTC at the very least to be able to purchase and load up on ETC - and even the ETC pump was incredibly lackluster in comparison to pumps we've witnessed when just RUMORS have gone out regarding XRP being added to coinbase) and SEC ruling on Bitcoin & Ethereum not being a security we would have expected a significant increase in price/volume and overall interest in BTC which we clearly have not gotten as of yet - I mean even with the SEC news the most we got was a $250 green candle. I am just not seeing the interest in crypto at the moment that we saw preluding the rallies in 2017 and for these reasons I am biased to believe that we have one more drop, one more chance to "BTFD" before we embark on the epic run everyone is awaiting.


Next target on IQ $34-$35!?Very nice bullish uptrend. Bought back my June $30 covered calls for a small loss today. Looking to ride this wave up to $45+ :)

Raytheon - Buy The Dip - Sell the TrendRaytheon had a nice earnings beat and the price took a tumble. Hopefully we will see a return to the previous growth trend (shown with Linear Regression @ 250 four-hours).
I've seen two articles on Seeking Alpha screaming the same thing I am:
BUY THE DIP!
The 'rate of change' graph shows RTN rate of change vs. SPY rate of change. It's just a script I'm working on right now.
SeekingAlpha articles:
seekingalpha.com
seekingalpha.com

1:3 Risk / Reward SetupUS equities corrected the April swing to the upside during the past few days. Some followthrough of this correction would result in a better S&P Elliott wave fit. However, this is not required.
The most important equity index worldwide may carry straight on from yesterday's low to the upside. The swing from last week's high, minute wave i(circle), into yesterday's low counts as a 3-wave pullback already.
What action makes an immediate rally likely (black count)? The S&P 500 is likely to follow the black count if 2683 is crossed to the upside. That action leaves a 3-wave pattern on the chart from last weeks high.
The trade triggers if 2683 crosses again to the upside.
S/L 2658 (yesterday's low)
Target: 2750
Good luck here as well!
PS: Don't forget to like & follow us. We are fairly new here on Tradingview but our ideas amounted to more than 250% return in just 4 Months. Check them out!

Good Pullback Long Entry for QQQ (30m) between 161 and 161.5 I think that if QQQ drops to the 161-161.5 zone, this offers a good long entry.
The reasons are as follows:
1. Gap fill from the morning gap up
2. Successful pullback to support zone
3. QQQ is still uptrending, so buying the dip has an edge
4. Good risk to reward.
If QQQ drops below 160.5, we take the small loss and move on. Our target is the minor high near 163.


BTC Prediction: Dip Before the Moon, Big Support at 7490.This is a 1D chart analysis; for further detailed analysis on this prediction see the 4h analysis I just posted using the Bitmex (XBT) chart.
BTC has had a phenomenal bullish wave upward. Now there is a good chance BTC will pull back on a healthy correction to test prior price structure support and the long-term uptrend support line shown here before making another leg higher.

BTC/USD - Why Weekly Levels Are Important Hey guys... been a few day since doing a video, so I thought I would highlight why I believe being mindful of weekly levels are extremely important to your trading plan. While I think indicators can be useful, personally, i'm trying more and more to minimize their use and stick to price action along and limit the amount of time spent in the charts. As I have mentioned before, the more and more time i spend in the charts the more i start to see what i want to see and that is not a good thing.
I hope you enjoyed the video, give me a like and leave me your thoughts!

Buy the dip in the spyLast week there was again some market panic which caused a selloff in stocks. There are a lot of broken charts right now on a lot of different stocks. But fundamentally market is still looking strong. So i'm going to buy the dip. In a few months there is a high chance we are back higher. Time to deploy cash on monday.

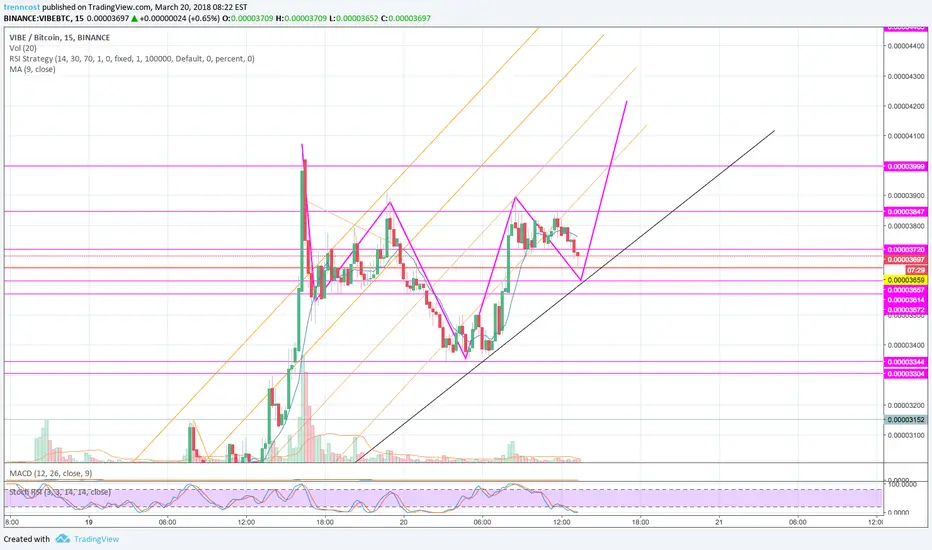
VIBE - Invers H&S on Investor News?Hi. Seems there will be an announcement of a multi-million investor for VIBE and soem other rumors. For now it pushed the price nicely. But I see a inverse H&S formation building up here for the next wave. Could reach 5k+.
Just an observation an idea of someone who has no clue. No financial advice.
VIABTC - JUST GETTING STARTED!BITTREX:VIABTC
VIABTC will certainly be one of the coins to watch in the upcoming Spring/Summer of 2018. With a max supply of only 23M and a market cap of only $62M, this coin is still grossly undervalued (currently under $3).
These fundamentals mean this coin has some SERIOUS upside mid-term potential.
From a technical standpoint, VIA has plenty of room left north of 30 on the daily RSI, and appears to be forming a Bullish MACD cross as well.
Given it's recent runnup to test (and be rejected) from the .786 fib extension (on the daily), after breaking out of the previous falling wedge pattern, one can presume it's likely to start making another run up north very soon. Next time, the upshot will be to test (and break) the all-time high (ATH) of 0.0085990SATs.
If this scenario were to play out, this would give $VIA the respectable target price of $10USD with a ~0.01200000SATs. Given the fundamentals, these targets are not only possible, but likely, IMO.
But first, we'll need to crack above (and consolidate) above a nearer-term target of ~60SATs.
Currently, VIA is undergoing accumilation between 0.00025-0.00030SATs, with several large players who have become attracted to this coin's potential. With that in mind, I suspect we VIA will start to make moves toward the upside again in the next upming week or 2.
That said, I you are looking to for a solid coin to to invest into near/mid-term, which is currently trading under true value, VIABTC is of notable mention.
This spring may be the last time we see VIA under $3.00.
Take care.

TRX MAINNET FOMOHI guys, I wanted to analyze the TRX/BTC on binance, but on Trading View is only Bittrex (less timestory).
This is my TA on Tronix (TRX) token, I'm not in about if it's scam or worth it , just cheking the bips ^^.
On 31 May it will be the official mainnet launch, it means a migration from ETH platform to their own platform, I predict:
1. Whales will buy TRX and it will be a bullish market.
2. Then lazy buyers will buy it down the FOMO effect (whales tactics + Mainnet launch).
3. Price will be between 1000-1500 sats, a good point to sell.

BTC Setting Up For Big Bullish Move COINBASE:BTCUSD Bitcoin is setting up to do something exciting. We have a potential huge inverse head & shoulders developing on the daily chart, and now that we have overcome the large downtrend line, we should be watching for higher lows and higher highs as signs to accumulate coins. On the hourly chart, I see old resistance becoming new support around 10765, and the 50ma (green line) as well as a bullish trendline converging near the most recent resistance point soon. The hourly 50ma and/or 11150 likely need to be tested again before a strong run, but seeing VWAP has been reclaimed shows buyers are already showing up, so this could go sooner than later. I'm buying dips here. As long as 10750 holds, we are cleared for take-off. Otherwise, I'll watch the hourly 200 ma (~10500) to hold for the next signal to buy-the-dip. A rejection at the yellow previous resistance line ~11720 would produce a buyable pullback as well (perhaps to the hourly 50ma), so I'll be watching that price line closely if we reach it soon. A breakout over that line with volume could run for days given that the distance between the head and the breakout point would be nearly a 100% move.
The lower indicators are also promising, with the WIlliam %R looking bullish with a double bottom support around the -50 line on the daily, and the hourly just now pulling over that midline. Breakout could be eminent...

Buy the dip in wayfairStock is right now forming a bottom. Between 70-75 dollar stock is a bargain imo. I will buy the dip, over time this stock can go back to 80 dollar and beyond.


MU BULLISH BOUNCE OFF THE EMASWatching for Bounce here off the 10. If we do not hold, will watch for a play off the 20 EMA. Solid play!

If I just had more BTC to spend...Those market insanity occasions are when I'd love my btc balance to be higher, so that I could buy more alts.
Everything is going down, and the best altcoins aren't spared.
I'll give you my short list, which could be way longer:
OMG
WTC
LINK
BNB
NEO
ARK
MTL
LSK
I believe they're all sure fires, which will go back up once the craze ends.
I don't exclude them going down further before Nov Fork, and that's the reason why you should average your buys in time.
BTW, everything below fib .50 is gold to me.
If OMG goes @.618 retracement, I'll definitely pour what I have left in it!!
Happy trading everyone!

Don't be unprepared when ARK will reverse!!It seems that some of the biggest altcoins (see NEO, OMG and ARK) are correcting quite strongly.
To me, those are all awesome buying opportunity, and these are the moments when I wish I had more money to invest.
ARK went on a crazy rally from mid aug to mid september, and we all know that the steeper the rise, the harder the fall. That's the reason why correction on ARK is particularly dramatic, and that's the reason why after gains like these you should sell!
BTW, I'm talking too much. The point here is that ARK has proven to be a solid coin, remaining strong also when BTC was crashing. So, get ready to jump on the boat, as once the correction will be completed, there'll be another fancy ride.
So, given I have a capital of 100 I want to put into ARK, I'd go like this:
25 @ .618 fib retracement (54k sats)
25 @ 47k sats resistance (if reached)
50 at reversal signals (price & RSI downtrend breakout, MACD crossover)
Buy the f*ckin dip!!!
