GOLD will rise againi have previously noticed that my final target is 1935 ..so i am still waiting till gold buy above 1918/15 zone..the situation like this, which displays on the chart ,what we could expect ?i am expecting a psychological reaction in 1920(psychological area).gold does a correction till 0.78 FIB level then it will rise till 1930 again.also we need to check price action above 1924/25 area.
please consider that.
Buyzone

EURCAD Getting Ready to Break the July Highs😮Hey guys , Ideal on EURCAD is That We are Overall Bullish Starting From the Daily Timeframe Down to the H4 Timeframe Which Price is Now Pulling Back to Level 1.44537 on H4 Timeframe for a Buying Opportunity to Then Target the July High . Drop Your Comments on the Comments Section,
Trade Safe James.❤

SUPER/USDT strong demand zoneIt seems that we will see a reaction to this demand area in the future.
In the past, we saw a strong failure of the structure, and due to the creation of appropriate liquidity levels, we can expect the price to grow again from the specified area.

Buy Gold 1937! Next Move...^_+Yesterday, we sold at the 1937 resistance level, but the price subsequently broke to new highs, resulting in a -30 pip loss on our 1937 sell position. With the price now above this former resistance level, we anticipate it to act as a new support. Our strategy is to initiate buy positions at 1937 with a stop-loss set at 1934. As previously mentioned, our target for these buy positions in gold is set at 1961. Best of luck with your trades!

XAUUSD BUY SIGNAL GOLDAccording to this analysis, after collecting the cash for confirmation in the buy gold transaction, wait for 1 minute to return to the initial order and then enter the transaction ( CHoCK - Filp). This signal will be deactivated if there is no confirmation of entering the transaction.

EURUSD BUYOne of the most important points of the Euro-Dollar that has the possibility of an upward rejection. Be sure to check Chock and Flap's 1-minute confirmations to enter

DXY analysis This is a long term analysis of DXY showed strong rejection from monthly FVG after a sweep of liquidity and now we are seeing a bullish momentum expecting this to get to a premium zone and a higher dxy for the next 1 or 2 months .

Market Stands Firm on Support!📊 Weekly Chart: Long shadow at support, prior resistance.
📈 Daily Chart: ABCD pattern, respecting support.
🕓 Four Hour Chart: Counter-trend trade possibility.
⏳ One Hour Chart: Bullish bat pattern, wait for confirmation.
🌟 Weekly Chart Insight:
- Market stands still in buy zone.
- Different from Eurodollar.
📊 Daily Chart:
- ABCD pattern, support respected.
- Previous trade resulted in 219 pips gain.
💡 Trading Opportunities:
- Confirmation of support for a buy.
- Counter-trend trade in the sell zone.
🦇 One Hour Chart:
- Bullish bat pattern.
- Wait for consolidation or double bottom.
- Use RSI Divergence for confirmation.

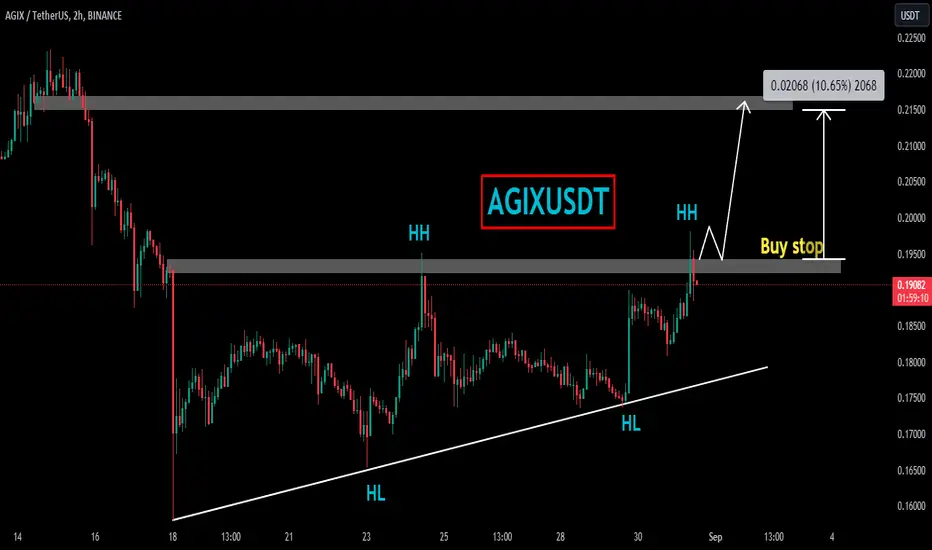
AGIXUSDTAGIXUSDT is in the making of new bullish trend.
As the market is started to print new HHs and HLs after the recent massive selloff.
currently the market is retracing a bit after last HH, if the market successfully close above 0.1945 level you can trade it with buy stop.
KPEL ready for another run?After a good run up the stock went into a consolidation range with support at 285-290 levels. A breakout above 355 with volume support indicates another potential good run upside in the short term.
Entry - 375
Stop Loss - 350
Target - 425/475

Gold fill fly morecurrently gold is trading in a bearish wedge pattern n D1 chart.Also it has been reacting for the 1910-1912 very strong resistance and the EMA 200 was supporting for the rejection
the situations like this what we can expect the higher rejection to the upside is possible .if gold trade above 1920 and behave steady above that area will move gold to 1929-30 strong resistance

AIRLINK - Golden Cross AIRLINK - GoldenCross Spotted
The bullish trend may continue in days ahead, targeting 29 -30 initially.

boshch long in geven zonethis given buy zone is good for longs to be created
a good stoploss will be red candle closing on day tf below the buy zone .
there this buy zone will be in validated and sellers will make a new resistance
till then one keep it as a good buying opportunity
also from ath to all time covid low this stock is near the .5 fibo retracement

TSLA Entry, Volume, Target, StopEntry: with price above 299.29
Volume: with volume greater than 142.36M
Target: 359.29 area (this is an area, no guarantee it reaches this price, but you should be selling on the way up)
Stop: Depending on your risk tolerance; Based on an entry of 299.30, 279.30 gets you 3/1 Reward to Risk Ratio.
This LONG swing trade idea is not trade advice and is strictly based on my ideas and technical analysis. No due diligence or fundamental analysis was performed while evaluating this trade idea. Do not take this trade based on my idea, do not follow anyone blindly, do your own analysis and due diligence. I am not a professional trader.

EURCADEURCAD has formed a wide range of over 100 pips.
Sometime ranges are good phase to trade , just sell the top and buy the bottom.
As the the EURO has fall sharply to support zone with bullish divergence, it seems like now is the time for bulls to take control.
What you guys think of this idea?


i'm just waiting to dive into this position If you look at my last idea, it’s all about the drop in US Dollars. If that happens, the US stock market is going to fly.
As you can see, the NASDAQ chart is getting ready to have a safe jump.
Now I’m just waiting to see the pullback reaction; That's when I’ll move into a buy position.

AMD Potential continuationI like this as continuation for the upside move.
I personally will be looking for buy at 100$,
80$ red zone as deeper discount buy.

Polkadot - key levels - investmentI think $4.585 is a perfect long-term buy zone. Dot has a monthly rangetrend that supports the upward move and some levels.
1st target - would be in the area of monthly resistance at the price of $7.42 - almost 60% profit.
2nd target - would be in the area of weekly resistance at the price of $8.54 - almost 85% profit.
If the Polkadot price never reaches this weekly support, you can buy at $5.55 for 30-40% of your budget, and if the price drops to $4.585 , you can buy the rest.

OP TO 1.9, SHALL WE HAVE IT Currently in an ascending wedge, I expect a test of that Order Block to send it higher to 1.9
Invalidation at 1.42
Set your alerts and take the trade
SEE YOU AT 1.9

GBPJPY BUYGBPJPY buy setup
The main reason is GJ is following its H1 trendline and we will be having a buyside trade the confluance is H4 RBS (Resistance become support) level and 2nd confluance is H1 200EMA support and an M15 level of support the BUY baised is strongly agreed

Gold BUYGold is continuously falling and now has reached on its daily support level around 1905 to 1910 also gold has formed a trendline structure which also followed its sell baised but it seems like on daily level of support price is going to break above its H1 trendline also on daily level price is also taking support on 200EMA which is also a good sign for BUY side
We will waiting and watching price if it breaks above 1910 level with a price action Bullish engulfing Morbozu we will buy this pair
Good luck 🤞

EURJPYEURJPY has formed the bullish flag pattern. Currently the price is hovering around the channel and it seems like the price is ready to break the flag amid weaker JPY.
what you guys think about it ?
