CME Long Good Risk reward to a good company
SL pink line. Blue green TP at 2/3 and let 1/3 run
Insider bought around this price
Date Filed Reporting Name Relationship Trans. Date Shares Price $ Total Value $
29 Mar 2023 SHEPARD WILLIAM R Director 28 Mar 2023 195 186.45 36,337
29 Mar 2023 SHEPARD WILLIAM R Director 27 Mar 2023 298 185.32 55,194
29 Mar 2023 SHEPARD WILLIAM R Director 27 Mar 2023 13 185.32 2,433
20 Jan 2023 SHEPARD WILLIAM R Director 18 Jan 2023 55 175.98 9,651
20 Jan 2023 SHEPARD WILLIAM R Director 18 Jan 2023 1,244 175.98 218,905
20 Jan 2023 SHEPARD WILLIAM R Director 28 Dec 2022 13 168.11 2,145
20 Jan 2023 SHEPARD WILLIAM R Director 28 Dec 2022 289 168.11 48,646
05 Dec 2022 TIERNEY ROBERT J JR Director 02 Dec 2022 1,500 176.55 264,825
08 Nov 2022 SHEPARD WILLIAM R Director 04 Nov 2022 40,000 170.00 6,800,000
08 Nov 2022 SHEPARD WILLIAM R Director 04 Nov 2022 8,645 170.00 1,469,636
08 Nov 2021 DUFFY TERRENCE A Chairman and CEO 05 Nov 2021 400 222.02 88,806
05 Nov 2021 DUFFY TERRENCE A Chairman and CEO 04 Nov 2021 200 220.21 44,042
05 Nov 2021 DUFFY TERRENCE A Chairman and CEO 04 Nov 2021 100 220.21 22,021
05 Nov 2021 DUFFY TERRENCE A Chairman and CEO 04 Nov 2021 100 220.20 22,020
05 Nov 2021 DUFFY TERRENCE A Chairman and CEO 04 Nov 2021 300 220.21 66,062
05 Nov 2021 DUFFY TERRENCE A Chairman and CEO 04 Nov 2021 600 220.26 132,153
05 Nov 2021 DUFFY TERRENCE A Chairman and CEO 04 Nov 2021 300 220.13 66,039
12 Jun 2020 SHEPARD WILLIAM R Director 11 Jun 2020 1,229 178.10 218,885
04 Jun 2020 SHEPARD WILLIAM R Director 02 Jun 2020 771 178.10 137,315
Buyzone

Johnson and Johnson J&J Retest support when last breakout after earning
Good risk and reward
Good entry point to a company that can keep forever
If trading:
SL at pink line
TP 2/3 at blue line and let 1/3 run. Change SL to entry price once hit the blue line tp

USOILUSOIL is in enormous bullish trend and best thing to do in such cases is just ride the trend. As the commodity is correcting a bit which technically giving a buy option for another leg up.
What you people think of it ?

EURUSDEURUSD is in nice bullish trend. Recently the price has retraced a bit and reached to our buy area which is also the region of inclining trendline. Bullish divergence is also suggesting a upward direction for pair.


Rising Wedge | $380Chart 4H Timeframes
Nvidia NASDAQ:NVDA is in Rising Wedge and reached to the resistance of Fibo Projection around $480
So I expect NVDA will reverse soon after it break down the lower line of Rising Wedge
NVDA has two support at 420 and lower at 370. It's over 10%, can consider use DCA strategy to join AI's race
Wait for next move


USDCAD Buying Shark
0.618 222
I am publishing this upcoming trade for the future.
Hopefully this debut is a trade a lot of people make money with.
Good luck.

XAUUSD buy oppertunityBuy at this level with proper risk management and confirmation of liquidity patterns .

Displacement Technology Watch: $QSWith a lot of attention ahead of its earnings report, NYSE:QS had a volatile reaction to the report yesterday, but it is one of several companies vying for dominance in Solid State Battery technology. Auto parts are a niche sub-industry of Electric Vehicles to pay attention to for both short term and long term.
From the weekly chart: The stock is building a bottom after a huge speculative run up after it IPO'd and is now in a basing bottom formation.
QuantumScape was on the NASDAQ Private Market before it IPO'd. Plenty of banks underwrote it and many Preferred Clients, aka Giant Buy Side Institutions, invested during its NASDAQ Private Placement. So it had a respectable amount of investment money to start moving forward faster.
On the daily chart, we can see NYSE:QS had a pre-earnings run that hit resistance which was followed by profit-taking ahead of the report. Pro traders started the run up out of what looks to be a Dark Pool Buy Zone and smaller funds chased, which is often a precursor to a volatile earnings reaction. The stock has a low Percentage of the Shares Held by Institutions at this time, which is another factor that contributes to heightened volatility, but it's one to watch as the EV landscape expands.

Thinking of Buying Gold - Long Position - Check out the entry So i have used fib levels to determine my buy setup for tomorrow.
FVG is very much present below 1945 mark -Many people would be at 1945 mark with Sl of 1940 -1939, but look at my fib level. Buy from discount price which is 1937-1938 and aim for 1963 as TP2. It can go further , but with Friday being slow and weird, i would stay out if i reached my target of 1963.
My chart is very self explanatory for those who have basic knowledge.
Let me know your thoughts

ABBV looks good for me to buy now As it shown on the chart NYSE:ABBV it is a good zone to open a new position because it is trading near by a daily support
My Stop Loss 4 Hours close lower than the support zone 133$
What do you think about ABBV ?

AAL Looks Good Fore Me To Buy Now As it shown on the chart my Entry price is 17.5
and my stop loss is Closing lower than 17$
the target is 25$
What do you think about NASDAQ:AAL

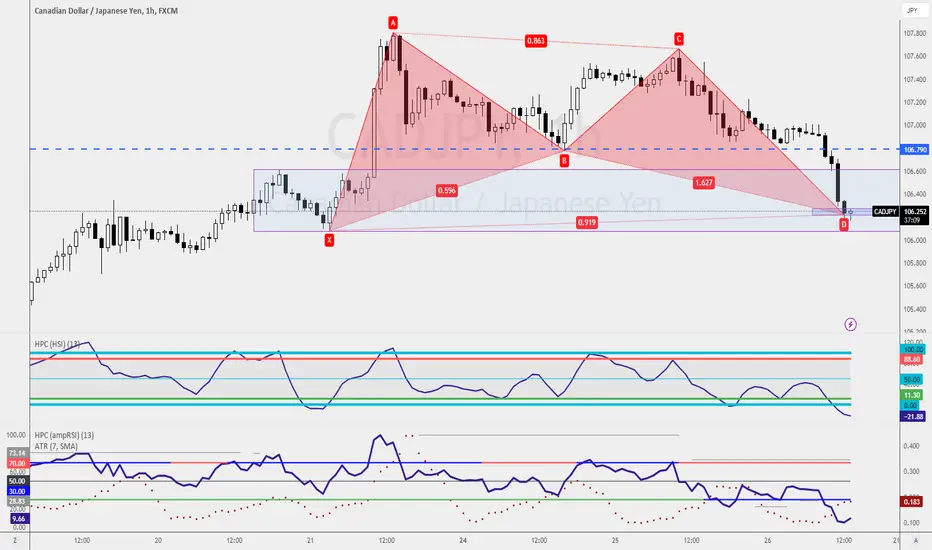
Bullish Bat Pattern within Buy Zone📈 CADJPY Bullish Bat Pattern 📈
Exciting opportunity on CADJPY! 🦅 A Bullish Bat Pattern is forming within the buy zone. 📊 Conservative traders target 106.79, while adventurous traders set their own targets. Remember to manage risk and stay informed. Follow @raynlim for more trading insights. Happy trading! 🚀
CADCHF MOVEMENTUsing support and resistance
The price may move to 0.65000 for market correction. after that the price may move towards 1st resistance at 0.65944 and if resistance breaks then we can expect a small bull run till 2nd resistsance 0.68000. There is a highly chance to buy at near to 0.65000 if market dones a correction and we can expect a good move here in upward direction because of support at 0.65000.

BUY OGNUSDT : BOTTOM OF RETRACEMENTAs the title suggests, right now, ~$0.0915 is the very bottom of the retracement and the perfect entry point to a coin I'm trading for the first time today.
Just shy of 100% certainty on this call, so you can hold me to it.
Enjoy.

USDJPY. 15min. OANDA(24/07/2023)Technical Indicators showing the buy trend and also give us buy signal so i prefer you focus on buy entry. let see....

EURAUD Buy at 1.6362 (has been trading in a bullish trend since)
Setup: The EURAUD is trading in a bullish trend and has recently broken out above the 1.6362 resistance level.
Entry: Buy at 1.6362 with a stop loss below 1.6316.
Target: 1.6450 and beyond.
This trade is based on the following technical analysis:
The 1.6362 resistance level was a key level of resistance, and the break above this level is a bullish signal.
The RSI indicator is in the overbought zone, which suggests that the trend may be nearing exhaustion.
The MACD indicator is bullish, which also supports the bullish trend.
The risk to reward ratio for this trade is favorable. The stop loss is relatively small, and the potential profit is significant. However, it is important to remember that no trade is guaranteed, and there is always a risk of loss.

GOLD BUYS FROM 1961Sell level hit at 1984, expecting price to move down to 1961 for some buys back to highs. If 1961 breaks gold will move as lower back to 1937 range. if price breaks 1984 we will see highs back to 2007.

AUDUSDH1 We have a strong buy from 50% fibo
Be careful the wave 4 does not come close to the top of the wave 1

GOOD retracement now SEND IT ETHGood retracement all the way to 61.8% which is time for reversal so i am buying right here
buy zone now
stop loss - 1870
tp1 - 2000
tp 2 - 2100
tp 3 - 3000


GOLD SHALL WE?well we have a FVG area there
I will expect that price will come back to that area before we can long it to 1978.
Also matches with Fibo at 0.168 which is known for reversal.
so we can expect a good long from that zone 1946- 1945
small stop loss of 1940.
