SOLANA - Plan since June 22'My accumulation plan for SOL solidified back in June 2022 and I had marked out overall structure I want to consider as an accumulation area with buy zones.
We have now entered (and quickly exited) my 2nd buy zone. Was that our only chance to get in around $8 or will we get another chance even cheaper?
I think the bottom is close, but I think we revisit the lows again in my buy zone 2 area before the bottom is finally done.
The blue path has now just been extended, time-wise, for a potentially exciting 2nd half of 2023 and into 2024.
I shared this chart back in June, plan remains otherwise!
Cheers
Buyzone

PSNY: MACRO ANALYSIS / INTERSECTING CHANNELS / SQUEEZE? (UPDATE)DESCRIPTION: In the chart above I have included an in depth MACRO ANALYSIS of PSNY.
IMPORTANT:
- With late Novembers PRICE ACTION rejection at around 8 POINTS this led me to consider that despite our current uptrend the CEILING of the PREVIOUS DOWNTREND CHANNEL IS STILL VERY MUCH IN PLAY.
- RESISTANCE THAT WAS SEEN AT 8 POINTS WAS EXACTLY WHERE THE INTERSECTION LIES FOR BOTH THE CEILING OF PREVIOUS DOWNTREND CHANNEL AND CURRENT UPTREND CHANNEL.
POINTS:
1. DEVIATION OF 1 POINT PER SUPPLY & DEMAND POCKET. (Gaps between Supply & Demand Pockets is due to lack of STABLE CONSOLIDATION)
2. FUTURE POINTS OF CONTACT were estimated by taking MEAN AVERAGES from PREVIOUS POINTS OF CONTACT.
3. PREDICTED 10 DOLLAR price target by FEBRUARY 14TH was estimated by taking into consideration how much previous rally made price action increase after serious consolidation.
4. IT IS CRUCIAL MACD BEGINS TO STAY CLOSE TO MEDIAN AS IT CAN BE A GREAT PREDICTOR FOR A POTENTIALLY BIG MOVE.
SCENARIO #1: In a bullish scenario price action follows given path or makes more points of contact eventually breaking to the upside from DOWNTREND CHANNEL CEILING.
SCENARIO #2: In a bearish scenario it is important price action does not fall below 5 points this would in fact invalidate entire setup.
FULL CHART LINK: www.tradingview.com
NASDAQ:PSNY
NASDAQ:PSNYW

we are long in jswsteel we are long in jsw steel till daily candle close above 736 we will se good up move soon

BITCOIN PREDICTION!!!! IS THIS THE BOTTOM???DESCRIPTION: In the chart above I have provided a MACRO to Micro analysis for BITCOIN by taking into consideration SUPPLY & DEMAND POCKETS along with recent BREAK OF DOWNTREND CHANNEL by a DESCENDING TRIANGLE PATTERN that can break either to the UPSIDE OR DOWNSIDE.
POINTS:
1. Year to Date puts BITCOINS price action at a -77.48% correction.
2. With a current 210 days consolidation within current SUPPLY & DEMAND POCKET.
Beginning with SUPPLY & DEMAND POCKETS BITCOIN shows a DEVIATION of 10,000 points between every "STABLE CONSOLIDATION PERIOD".
2. DOWNWARD CHANNEL that began at 66,000 points was broken when price action hesitated to fall below 16,000 as SIDEWAYS CONSOLIDATION continued.
3. RSI is showing signs of steady bullish momentum in a much more stable fashion than before.
4. MACD is indicating that a big move is on the way since buying and selling pressure is in between.
*NOTE: Lose of current SUPPORT OF 16,000 would invalidate any BULLISH MOMENTUM.
SCENARIO #1: Continuation of sideways momentum that eventually breaks 20,000 point entry could push BITCOINS price higher.
SCENARIO #2: Discontinuation of sideways momentum and a fall below 16,000 point crucial support can eventually lead the way to a 13,000 entry.
BITSTAMP:BTCUSD

Can $ESAB go higher from here?Notes:
* Moving up on the right side of its IPO base
* Good earnings
* Breaking out of an ascending triangle with higher than average volume
* Has a 50 day UD ratio of 2.26 and a 15 day UD ratio of 5.27; indicating that there's been a ton more buying short term
* Has a solid relative strength in the sector and against the SP500
* Showing an early entry relative to its 50 day line
* Printed a pocket pivot, indicating institutional demand
Technicals:
Sector: Industrials - Metal Fabrication
Relative Strength vs. Sector: 2.87
Relative Strength vs. SP500: 14.88
U/D Volume Ratio: 2.26
15 Day U/D Volume Ratio: 5.27
Base Depth: 77.73%
Distance from breakout buy point: -16.17%
Volume 21.39% above its 15 day avg.
Trade Idea:
* Now's a great time to jump in as it's close to its 50 day line, printed a pocket pivot and breaking out of its ascending triangle
* If you're looking for a better entry you may look around the 48.1 area as it may retest that level for support
Some resistances to keep in mind are $49.2 and $51.3. There may be sellers in these areas.

ES1! RALLIES & FALLS (UPDATE)DESCRIPTION: In the chart above I have provided an updated version of my previous chart for ES1! .
POINTS:
1. Price Action has broken previous pennant and fallen into a consolidation phase.
2. Breaking through this consolidation phase would either require breaking 3900 to the upside or 3800 to the downside.
Current Fall Percentage = -9.47%
Current Fall in Points = -1585
Average Fall Percentage = -14.63%
NOTE: *Highlighted Channel 3800 - 3900 is current price action range where DIX HAS SHOWN TO SPIKE THE MOST.
CME_MINI:ES1!

AMZN: Moving into A Buy Zone?The Weekly Chart of AMZN shows that the stock has dropped into a strong support price level with a risk that there could be a Dark Pool Buy Zone here. The share price is now below fundamental values.
With a month before AMZN reports earnings, it will be interesting to see how the stock behaves; it will reveal how well AMZN is recovering from the hyper revenues created by the stay-at-home orders and stimulus checks of the pandemic. This is the last quarterly report that will be skewed with the revenues and earnings from the pandemic anomaly.
This company MUST provide a dividend soon.

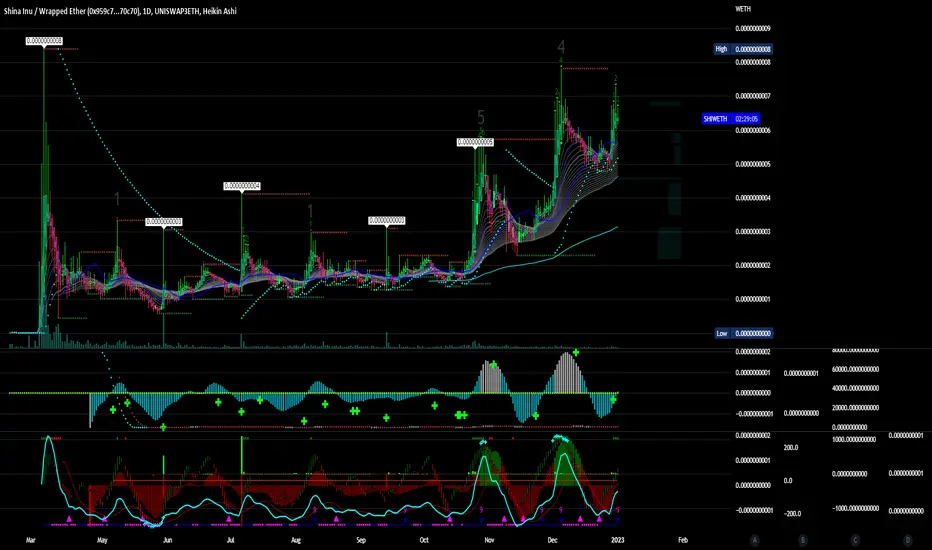
$SHI Shina Inu 💖Shina Inu (SHI) price has increased today.
Shina Inu price today is $0.000000764208 with a 24-hour trading volume of $41,655.93. SHI price is up 2.5% in the last 24 hours. It has a circulating supply of 14 Trillion SHI coins and a total supply of 14482056376677.0. If you are looking to buy or sell Shina Inu, Uniswap (v3) is currently the most active exchange.
Kaspa Getting close to buy zone ).045 and lowerKaspa Getting close to buy zone ).045 and lower.
Hoping it will reverse this downward trend after going side ways a little at around 0.045 :)

EURNZD I Short-term buy from supportWelcome back! Let me know your thoughts in the comments!
**EURNZD Analysis - Listen to video!
We recommend that you keep this pair on your watchlist and enter when the entry criteria of your strategy is met.
Please support this idea with a LIKE and COMMENT if you find it useful and Click "Follow" on our profile if you'd like these trade ideas delivered straight to your email in the future.
Thanks for your continued support!

SPX500: When is the right time to buy?SPX will soon touch the buy zone near 3500-3700.
Marked by green rectangle in the chart, this is very crucial zone for the following reasons:
1. This zone is supported by long-term, uptrend channel.
2. It is also supported by short-term, downtrend channel.
3. Market has already recovered from this zone once.
Here are also fundamental reasons to believe why this is an important zone.
1. US Inflation, which peaked at 9.1% in Jun-22, is now reversing. It dropped to 7.1% on Nov-22 and is expected to continue downtrend. However, caution is advised that the figure of 7.1% is still alarming.
2. Oil is witnessing a downtrend. It is almost halfway ($75 a barrel) from the peak of $130 a barrel.
I don't see the market flying high from the buy point, but profit is possible for swing traders and accumulation for investors.


MATIC/USDT (looking bearish)#matic
i am taking short at 9.490
sl at 0.9758 2.5%
tp 0.8570 10%
matic will be soon no more moon :)

ICX/USDTicx looking bullish
icx making many pattern
also good fudamentals,sentiments
let's see kiya hota

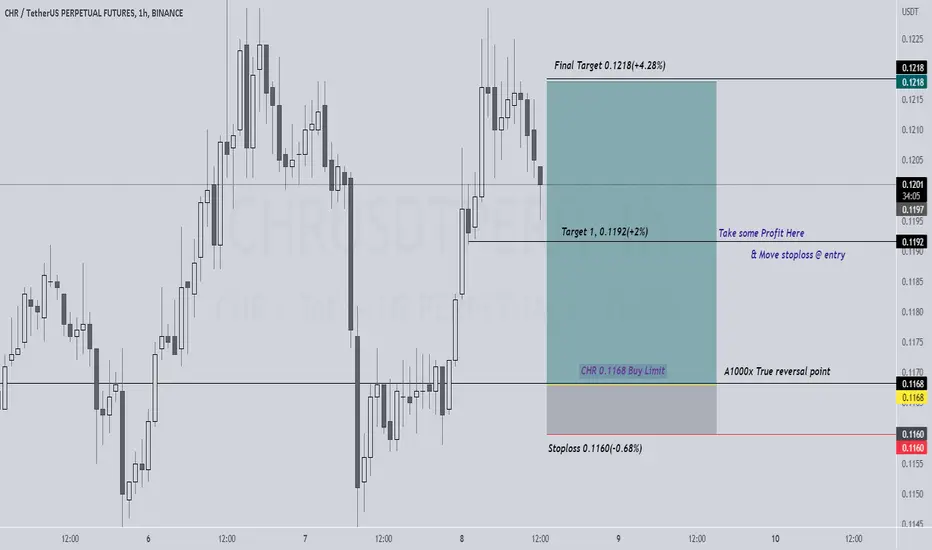
CHR Reversal zoneHello traders!
Welcome back to another episode with Analyst Aadil1000x.
Today we are going to Buy CHR from the Reversal zone with tight stoploss.
CHR 0.1168 Buy Limit
Stoploss 0.1160(-0.68%)
Target 1, 0.1192(+2%)
Final Target 0.1218(+4.28%)
Don't forget to hit the like button and follow to stay connected.
ROKU Bottom Formation: Dark Pool Buy ZoneROKU is a good example of a high-risk sell short. The HFT gap was reversed the same day. You are looking at a Dark Pool BUY ZONE. Accumulation/Distribution confirms a shift of sentiment even as this stock turns down at a bottoming resistance level which is NORMAL and expected.
The company reports earnings for the holiday season in mid February. This makes for a common timeframe for a bottom formation's base to develop.

there are too many HCS and ATT negetionI'm waiting price to react from the zone to high it doesn't matter how long my buy order tp I will hold till last tp and waiting to go upper to give confirmation to higher

EURUSD: Bullish OutlookHey traders!
I'm still looking for buys this week for EURUSD.
Although the previous FVG is short, I'm waiting for it to break through the resistance area and continue bullish.

USDJPY-Weekly Market Analysis-Nov22,Wk5You have seen how the Fib Extension work in an amazing manner(check out related ideas within the tradingview post USDJPY - Fib Extension) it will allow you to capture 149pips of profit just by doing that.
My analysis on USDJPY remains bullish; one of the most aggressive engagements is to wait for the market to retest on the trendline; the stop should go below the previous structure low with our special buffer calculation.

USDJPY - Fib ExtensionOne of the ways to engage in a buying opportunity on USDJPY is by using the Fibonacci Extension, in this case, the setup is completing at 138.02 within the buy zone and not violating the double bottom pull-back.
A 3-bar reversal at the level is the minimum I'm waiting for.

USDJPY - Double Bottom PullbackA double-bottom pullback allows traders to engage in a buying opportunity. What is important to look out for is that the setup should never break and close below 137.68.

SPX may test 4325 againNEO WAVE study(daily)clearly indicates that c4 rally ended and start of wave C5
c5/1 may get supported at 4086,expect a recovery wave c5/2 to 4325

USDCAD - it's pretty bullishThe USDCAD seems to be a pretty bullish setup, we might not get pullback back into the buy zone, and the best we could have could be retesting on the tip of the buy zone.
Let's look and observe how the current candle closes.
