USDJPY-Weekly Market Analysis-Nov22,Wk4My bias is still bullish on the USDJPY, you can check out the related ideas within this tradingview post. One way to engage it is to wait for the Bullish Bat Pattern to form at 139.08 on the day trading timeframe.
A candlestick pattern confirmation is required, no matter how confident you are in this setup.
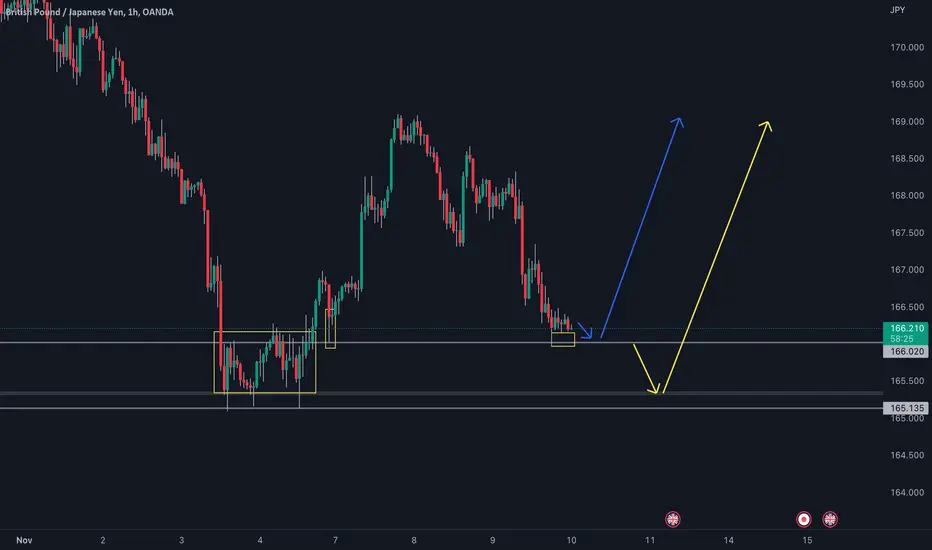
Buyzone

TOP US-Stocks: Buy-Signal ADPThe stock just broke through a perfect buy point and triggered a buy-signal. The stop loss level and profit target are shown in the graphic.
All stocks on our watchlists meet the hard selection criteria according to Mark Minervini's Trend-Template and William o' Neil's CAN SLIM methodology AND
are in the process of developing a Perfect Buy Point and a low-risk entry, following a volatility contraction pattern.
The stock just broke through a perfect buy point and triggered a buy-signal. The stop loss level and profit target are shown in the graphic.
🍾🍾 We trade like the Champions 🍾🍾
Are you struggling with your trading strategy? Follow me to get free, real-time trading signals which are all based on Mark Minervini's success-proven strategy.

Thinking About Buying/Selling GBPUSD ? This will help you :)You will see by reading my previous posts this pair has been moving exactly as expected since hitting the lows @ 1.04 it's been correcting at the predicted levels like clockwork picture perfect lol
What's next you ask ? As wrote in previous posts the SUPPLY/SELL zone at 1.21-122 is a target we got a small reaction at the 1.20 previous support/low I expect the market to pop back up towards the 1.21 area so I will be looking for my indicator to give a SELL signal on a time frame from 4hr-daily ass price goes above 1.20.
The first easy target will be the 1.16 previous swing high in current up leg we also have a newly created weekly DEMAND/BUY zone around 1.15 so this will be target area. You will also be looking to buy back into the up leg at this level too.
Let's see how we go read my related posts on this pair

US Stocks in the Spotlight: NOGNorthern Oil & Gas (NOG)broke out of a solid volatility contraction pattern on Nov 10th. A perfect buy point was established at the threshold of 36.3. Volume surged when shares broke out in September and have held above their 50-day line, despite high volatility since that time.
The stock is on its way into new all time highs and still in a buy zone.
NOG is the U.S.'s largest publicly traded non-operated oil and gas exploration and production company. It holds stakes in established oilfields in the Permian Basin in Texas and New Mexico, Williston in the Dakotas and Montana, and Marcellus in Pennsylvania.
The Minneapolis-based investor typically buys stakes in oilfields and partners with seasoned operators.

IS $ABBV ready to come up on the right side of its base?Notes:
* Strong up trend on all time frames
* Great earnings track record
* Basing for the past ~8 months
* Now looking to come up on the right side of its base
* Printed a pocket pivot in the last session, indicating institutional buying
* Offering an early entry relative to its 50 day line
Technicals:
Sector: Healthcare - Drug Manufacturers - General
Relative Strength vs. Sector: 6.46
Relative Strength vs. SP500: 2.33
U/D Ratio: 1.4
Base Depth: 28.76%
Distance from breakout buy point: -12.22%
Volume 18.24% above its 15 day avg.
Trade Idea:
* You can enter now as the price is coming off of its 50 day line
* If you're looking for a better entry you can look for one around the ~147 area as that should hold as support moving forward
* If you're looking for a safer entry you can wait for a break and close above the ~152.5 area as that is the immediate resistance coming up
* A daily close below the ~147 area would negate the bullish outlook.

USDJPY-Weekly Market Analysis-Nov22,Wk3This is what trading can be, I am waiting for a buying opportunity within the buy zone. For that to happen, a double-bottom setup is a minimum setup that is required before I consider a buying opportunity.

GBPJPY SetUPRight now we have GBP stronger than JPY, but it will be possible to see a deeper pullback to collect more buy orders.
Is $BJ ready to push higher?Notes:
* Strong up trend on the higher time frames
* Great earnings track record
* Basing for the past ~3 months
* Forming a cup and handle with the base ~14% deep and a flat handle
* Formed a bullish engulfing candle a couple of days ago
* Now it's flashing an early entry along with a pocket pivot
Technicals:
Sector: Consumer Defensive - Discount Stores
Relative Strength vs. Sector: 4.8
Relative Strength vs. SP500: 2.23
U/D Ratio: 1.03
Base Depth: 13.97%
Distance from breakout buy point: -1.6%
Volume 15.02% above its 15 day avg.
Trade idea:
* You can enter now as the price is close to its 50 EMA
* It's also breaking above the resistance area of ~77.5 with volume
* If you're looking for a better entry you may be able to catch it around $76.1 as that should hold as support going forward.

Is $CPRX ready to break out of its cup and handle?Notes:
* Strong up trend
* Okay earnings track record
* Basing for the past ~8 weeks
* Pulled back to its 10 week line and managed to hold it as support creating a cup and handle pattern
* Printed a pocket pivot near its 50 day line offering an early entry and indicating institutional demand
Technicals:
Sector: Healthcare - Biotechnology
Relative Strength vs. Sector: 23.86
Relative Strength vs. SP500: 4.28
U/D Ratio: 1.21
Base Depth: 45.07%
Distance from breakout buy point: -18.82%
Volume 14.75% above its 15 day avg.
Trade Idea:
* You can enter now as the price is rising with higher than average volume off of its 50 EMA
* Another reason for entering would be that it printed a pocket pivot
* If you want to play it a bit safe you can wait for a break out of the indicated channel and the 14.3 area since that may serve as immediate resistance

Is $PRCT ready to move higher from here?Notes:
* Steady up trend in a bear market
* Nice earnings for the past to quarters
* Recent IPO
* Looking to break above its IPO base
* Printed a pocket pivot, indicating institutional buying
* Offering an early entry relative to its 50 day line
* Sitting just above a pivotal level of 43.9 and holding it as support for the past several sessions
* IPO base resistance comes in around 47.7
Technicals:
Sector: Healthcare - Medical Devices
Relative Strength vs. Sector: 15.62
Relative Strength vs. SP500: 4.68
U/D Ratio: 1.1
Base Depth: 182.59%
Distance from breakout buy point: -4.82%
Volume 54.55% above its 15 day avg.
Trade Idea:
* You can enter now as the volume and price are indicating of it moving higher from here.
* If you want to be a bit more safe, you can wait till after earnings

USDJPY is still a strong Bull!With all the BOJ intervention, USDJPY still stands strong; by the end of this week, at max next week, it will be back at the previous level.
So, counter-trend traders, if you are looking for an aggressive kind of trend reversal trade; think twice before you act.

EUR JPY strong buy signalHello, as you can see from the chart, we have a pretty strong level.The price repels him, and gives us the opportunity to buy.

META, Our prediction (6 months ago) worked well. Lets review !Our two predicted targets for META (FB) is reached and I suppose third one will also be achieved in up coming months or years.
I though that it might be useful to review the analysis as it is still valid and working well .
Good luck everybody.
Followings are description of the chart which I published 6 months ago :
Stocks fall one after another !
We Saw a considerable decline in FB (Meta) Stock after earning report after hours of last trading session. What is happening for FB (Meta) in terms of Elliott waves?
FB (META), has likely completed a primary degree ascending cycle started on 4th Sept 2012 at 17.55 USD. This cycle took 9 years to be completed therefore, we can imagine how boring will be the correction phase before completion !
If true, FB (META) has started a correction decline form ATH (384.33) down to Retracement levels with today's pre-market price around 0.382 level.
Although 0.382 retracement is also possible for wave 2s , I give very low possibility to bounce back from this level according to timing and corrective patterns.
Retracement down to 200 , 157 and even 96 USD corresponding to 0.5 , 0.618 Golden Ration and 0.786 Retracement levels is very possible, I tried to show the probability of each possible Retracement with thickness of arrows with the thickest to be the most probable ( As I suppose ) and vice versa.
After completion of this primary degree wave 2, there will be a huge up going wave which is primary degree wave 3 . This wave 3 will push the price up to at least 700 USD and even higher ( Very good news for long term investors ) depending on at which retracement level this boring correction phase ends. It is too soon to talk about this target we can update our targets in next years !
Please note this is a very long term prediction so, there will be lots of ups and downs and fluctuations in our path. What is happening on FB (META) is more than likely similar to whats happened for ETSY , SHOPIFY, SQ and many others in the market.
As I showed on the chart, this is what I see as the most probable scenario which means there are more optimistic scenarios. Mots probable more optimistic scenario is that FB ( META) is just correcting the wave cycle labeled as wave (5). As far as the stock is trading above 170 USD, this scenario is valid.
Hope this analysis to be helpful and wish you all the best.

Can $MNTK continue to lead the Utilities sector?Notes:
* Recent IPO with steady up trend
* Not the best earnings in the recent quarters
* Basing for the past ~3 months
* While basing it bounced off of its IPO highs around the 13.8 area
* Recently breaking and holding above a pivot area between 16.65 and 16.9
* Daily and weekly volume seems to be indicating buyers coming in and the UD ratio seems to be indicating the same
Technicals:
Sector: Utilities - Utilities - Diversified
Relative Strength vs. Sector: 10.61
Relative Strength vs. SP500: 35.4
U/D Ratio: 0.96
Base Depth: 46.96%
Distance from breakout buy point: -15.4%
Volume 31.76% above its 15 day avg.
Trade Idea:
* You can enter now as the price is holding the 16.9 area as support
* If you're looking for a better entry you can wait to see if it retests the 16.9 area again.

Is $PI ready to break out of its ~10 month cup and handle?Notes:
* Strong up trend on higher time frames
* Excellent earnings track record
* Basing for the past ~10 months
* Forming a cup and handle pattern while basing
* Printed a pocket pivot signal, indicating institutional buying
* Volume on the daily and weekly time frame seems to be increasing as well
* Strong resistance around the $90 area
Technicals:
Sector: Technology - Communication Equipment
Relative Strength vs. Sector: 6.75
Relative Strength vs. SP500: 17.9
U/D Ratio: 1.09
Base Depth: 137.32%
Distance from breakout buy point: -10.12%
Volume 79.85% above its 15 day avg.
Trade Idea:
* You can enter now based on the pocket pivot signal
* Or given the market conditions you may wait for a break out of the handle as indicated or even a break above the $90 area

Is $CLFD ready to start coming up on the right side of its base?Notes:
* Strong up trend on all time frames
* Great earnings in the recent years
* Basing for about 9 weeks
* Starting o come up on the right side of its base with volume
* Created a launch pad with the 10,20 and 50 EMAs
Technicals:
Sector: Technology - Communication Equipment
Relative Strength vs. Sector: 4.11
Relative Strength vs. SP500: 6.57
U/D Ratio: 1.24
Base Depth: 43.31%
Distance from breakout buy point: -18.43%
Volume 0.44% above its 15 day avg.
Trade Idea:
* You can enter now as it's just coming off of the launch pad with volume
* It's also breaking above a clear resistance area of ~105.4
* If you're unsure at the moment you can wait for a retest of the the ~106 area as support before jumping in.

UPDATE OF PREVIOUS CALLOUTPattern confirmed and currently in a profit zone. Now would be a great time to move the stop loss (Red Line) into a profit zone or slightly above break even.

$BAH is breaking out of a ~21 month long base! Can it go higher?Notes:
* Strong up trend on the higher time frames
* Great earnings track record
* Broke out of a ~21 month long base
* Higher than average weekly volume and coming off from its 10 week line
* Also breaking out of a smaller consolidation of ~12 weeks
* Gaped up a couple of days ago and is now coiling
* Broke historical resistance around the $97 area
Technicals:
Sector: Industrials - Consulting Services
Relative Strength vs. Sector: 3.15
Relative Strength vs. SP500: 2.07
U/D Ratio: 1.37
Base Depth: 7.78%
Distance from breakout buy point: 0.23%
Volume 55.27% above its 15 day avg.
Trade Idea:
* Now's a great time to buy since the price is just breaking out and is close to the break point
* If you're looking for a better entry you may look for one around the ~97.85 area as that should hold as support

BTC Close to BottomThe price has formed a falling wedge. This could be an indication that the price will break to the upside.
RSI is under the 30 threshold, this means that is oversold.
The target is 50.00 % of the Fibonacci retracement.
Target: 34329.56
Entry: buy zone in the chart

USDJPY-Weekly Market Analysis-Oct22,Wk3Trend Traders you can wait for a buying opportunity when the candlestick pattern touches 147.66 but not close beyond the blue box.
I'm bullish on USDJPY and will be waiting patiently to hop on to the ride.

$ENSG poised to go higher from here?Notes:
* Very strong up trend on the weekly/monthly charts
* Great earnings for the past few years
* Basing for the past 19 months
* Creating a cup and handle
* Trying to break out of the handle
* Strong resistance around the $85.4 area
Technicals:
Ticker: $ENSG
Sector: Healthcare - Medical Care Facilities
Relative Strength vs. Sector: 28.52
Relative Strength vs. SP500: 11.74
U/D Ratio: 1.15
Base Depth: 36.29%
Distance from breakout buy point: -9.18%
Volume 16.02% above its 15 day avg.
Trade idea:
* Not jumping into this just yet.
* Waiting to see if it can stay above the $85.4 area and hold it as support.

GOLD BUY ZONE ACTIVATEDGOOD EVENING FOLLOWERS!
gold is looking tasty today as we have tapped into our buy zone of 1660-1665 area.
ny session should pump this up from this area

USDJPY-Weekly Market Analysis-Oct22,Wk2In my analysis of the USDJPY Daily Chart, the Bearish Crab Pattern still stands. At this moment it is a Bearish Crab Pattern checkback, which means it is at its best possible price for interested traders to engage this trade with the best Reward:Risk that is possible that happens on the Crab Pattern.
Personally, I'm not that crazy about that because of the prolonged consolidation. I'm more interested in the buying opportunity as I believe that USD still have room for appreciation.
