BTC | MASSIVE CORRECTION or BULLISH PATTERN?After the new of the recent ByBit hack, the entire market seems to have taken a dip.
(more on the bybit hack here:)
Luckily, seeing a 20% correction on Bitcoin isn't strange.. at all. It's actually quite common for the price to correct anywhere between 15% and 30%. The tell all sign will be whether or not we can reclaim the key support ABOVE 90k, otherwise we might be heading closer to that 30% dip.
Meanwhile.. another altcoin is approaching a key buy zone. Don't miss it, here:
_______________________
BINANCE:BTCUSDT
Bybit


AnalysisAnalysis 🚨
NASDAQ:AVL is testing the red resistance zone 🔴. If the breakout is successful, the first target will be the green line level 🟩.
🎯 Target:
🔵 1️⃣ First Target: Green line level

Why is the market crashing?Why Did Bitcoin Crash to $78K? Here’s What’s Driving the Panic
Bitcoin soared to an all-time high of $109K in January 2025, but last night, it crashed to $78K, a brutal 26% drop, leaving it hovering around $80K. The market’s in full panic mode, and after digging into the latest news, here’s why: Trump tariffs, the Bybit hack, and a mix of other pressures are to blame.
1. Trump Tariffs: Trade War Chaos
The Trump administration’s new tariffs, 25% on Mexico and Canada, 10% on China, are shaking up global trade. Here’s the impact on Bitcoin:
Uncertainty Surge: Higher costs and trade disruptions spook investors.
Risk-Off Mood: People ditch volatile assets like Bitcoin for safer bets like bonds.
Sell-Off Trigger: The fear of an economic slowdown is hitting crypto hard.
These tariffs are a major reason for the market’s jitters.
2. Bybit Hack: $1.5B Gone
A massive hack hit Bybit’s Trust Wallet, with $1.5 billion in Ethereum stolen, the biggest crypto heist ever. Here’s why it’s tanking Bitcoin:
Trust Shattered: Security breaches like this make everyone nervous about crypto safety.
Panic Selling: Fear of more hacks or losses sparks a rush to sell.
This event is amplifying the crash big time.
3. Other Crash Fuel
Beyond tariffs and the hack, these factors are piling on:
Macro Fears: Uncertainty over Federal Reserve rate hikes is pushing investors away from risk.
Profit-Taking: After hitting $109K, big players cashed out, adding pressure.
Post-Halving Dip: Bitcoin often corrects after halvings (like 2024’s), and we might be feeling that now.
What’s Next for Bitcoin?
This crash sucks, no doubt, tariffs and a billion-dollar hack are a nasty combo. But Bitcoin’s bounced back from worse. The panic might ease once the news settles, though recovery could take a minute. Keep an eye on trade updates and crypto security news, they’ll drive what’s next.

February 27 Bitcoin Bybit chart analysis
Hello
It's a Bitcoinguide.
If you have a "follower"
You can receive comment notifications on real-time travel routes and major sections.
If my analysis is helpful,
Please would like one booster button at the bottom.
This is Bitcoin's 30-minute chart.
Nasdaq indicators will be announced at 10:30 in a little while.
It is rebounding after breaking away from the previous low yesterday,
but today's main point of view is the Bollinger Band 4-hour chart's center line touch section.
Both Nasdaq and Bitcoin are in similar positions.
I created today's strategy centered on this part.
The purple finger at $82,610 on the lower left
is the 3rd place in the long position entry section on February 26.
* When the blue finger moves,
it is a short->long switching strategy centered on long positions.
1. $88,577.5 short position entry point / stop loss price when orange resistance line is broken
2. $85,093.5 long position switching / stop loss price when green support line is broken
3. $92,090.5 long position 1st target -> Good 2nd target
If it reaches the Good section, the final short position switching
(Approximately the center line of the 12-hour Bollinger Band chart.)
If it falls immediately from the current position,
The 1st section at the bottom, $85,724.5, becomes the long position entry point.
(Same stop loss price when green support line is broken)
Since there is pressure from the 4-hour MACD dead cross in the Tether Dominance that moves in the opposite direction of the beat,
If it succeeds in rebounding in section 1,
There is also a possibility that it will strongly break through the center line of the 4-hour Bollinger Band chart. (Bitcoin is in the process of a 4-hour chart MACD golden cross)
In real time, Nasdaq is touching the center line of the 4-hour chart first.
The proper order has finally been created.
Even if Bitcoin doesn't rest on the weekend,
the order of Nasdaq -> Bitcoin is correct in terms of the pattern.
With the forced coupling with Nasdaq,
today's analysis is particularly difficult from the drawing to the entry point haha
The 2nd section at the bottom is the final long position entry point for today,
and if it reaches this section,
there is a low probability of a sweep in Tether dominance. (Bit case skyrockets)
Bottom is a double bottom -> There is a possibility of additional adjustment in the 3rd section,
so please note, and this week, if possible, it would have been good if the previous low was not broken,
but it ended up breaking and is going through a difficult time.
Up to this point, please use my analysis as a reference and only as a level of use,
and I hope you operate safely with principle trading and stop loss prices.
Thank you.

ETH | ByBit HACK causes MASSIVE SELL-OFFBybit got hit with a serious security breach.
$1.4 billion was hacked in Ethereum, which is a huge amount of ETH. 2 Apparently the trouble started with their cold wallet, where they keep a lot of their crypto offline. The investigation points to the North Korean Lazarus Group as the likely culprits, and it seems the attack originated from some malicious code within their wallet provider, Safe Wallet.
Currently there's a big push to track down the stolen funds, and Bybit's even offering a bounty, but it's unlikely the funds will be recovered. It's important to understand that this wasn't necessarily a fault of Bybit's own security, but rather a problem with the wallet provider they were using.
Bybit has reassured users that withdrawals remain unaffected and other cold wallets are secure. While investigations into the incident continue, early speculation about Bybit buying back ETH to cover losses, which briefly boosted ETH's price, was dispelled by CEO Ben Zhou. He clarified that a bridge loan covered 80% of the stolen ETH, and there are no plans for spot market purchases. The hackers now holds a substantial amount of ETH across multiple wallets, raising concerns about potential drops should they decide to sell, but this may occur gradually over many months or even years (since they didn't buy it / it will not matter at what price it is sold).
This hack coincides with ETHDenver, a major Ethereum event typically associated with bullish market conditions and optimism. But overall, the outlook for Ethereum isn't looking as bright as it usually would be and this may lead to a further sell-off once more people catch on.
_________________
BINANCE:ETHUSDT

February 25 Bitcoin Bybit chart analysisHello
It's a Bitcoinguide.
If you have a "follower"
You can receive comment notifications on real-time travel routes and major sections.
If my analysis is helpful,
Please would like one booster button at the bottom.
Here is the Bitcoin 30-minute chart.
The Nasdaq indicator will be released at 12 midnight tonight.
In the case of Bitcoin, it is coupled with Nasdaq and is falling without asking.
Since there is no short position entry point yet,
I proceeded a little safely until today because there was a risk factor.
*Long position strategy when the blue finger moves
1. Purple finger at the top 90394.5 dollars
Autonomous short operation section / Stop loss price when orange resistance line is broken
2. 87759.5 dollars Long position entry section / Stop loss price when green support line is broken
3. 92340 dollars Long position 1st target -> Top, Gap in order of target price.
Since it can rise strongly from dawn,
I did not operate a separate short position.
(In the case of Tether Dominance, since it is difficult to sweep from the current position, if it is not a direct crash, the rising pattern is maintained, so the part that is gradually broken is included in the strategy.)
There is an additional autonomous long entry position in the first section at the top.
The purple finger touch -> 87.7K from the current position is the safest,
and if it goes down right away, it is a long wait in the second section.
If you look closely at the green support line,
you will see a bright sky blue support line.
I used the falling wedge section as a long position.
(Daily support + weekly central pattern and candle tail)
Among the patterns I have been waiting for,
Because it is the first touch of the central line of the Bollinger Band weekly chart,
I will find the next support line and operate it from today's departure from the second section until this week.
Up to this point, my analysis article is simply asking for your help.
I will see you tomorrow depending on the participation rate today.
I hope you operate safely with the principle of trading and cut-off price.
Thank you.

$BTC bearish outlook: $2B selling pressure incomingI am bearish on CRYPTOCAP:BTC for the following reasons:
1️⃣ The $Bybit hack resulted in a loss of $1.4B worth of $ETH. To continue trading, Bybit is currently bridging liquidity with Binance. However, this is only a temporary solution. Eventually, they will need to buy back $1.4B in ETH, and the only reserve asset large enough to cover this is Bitcoin. I expect at least SEED_TVCODER77_ETHBTCDATA:1B of BTC to be sold on the market to acquire the necessary ETH.
2️⃣ The hackers are liquidating their $1.4B in stolen ETH. Since smart contract-based assets can be traced and frozen, their best option is to swap to CRYPTOCAP:BTC , which is harder to track and cannot be frozen.
In total, Bitcoin faces a potential selling pressure of over SEED_TVCODER77_ETHBTCDATA:2B , which is enough to significantly impact its price.
📉 Given that Bitcoin is already in a consolidation phase, this pressure could push the price down to $93K or even $91K.
📊 Expect dead cat bounces, where traders can profit, but be cautious—this selling pressure is real. Bybit needs to resolve its liquidity issues quickly, and the hackers are racing to cash out ASAP.
⚠️ DYOR (Do Your Own Research).

ANALYSIS: $IPNYSE:IP is testing the red resistance zone 🔴 and could face rejection.
⚠️ Be aware – if it fails, the price could drop back to the green zone 🟩.

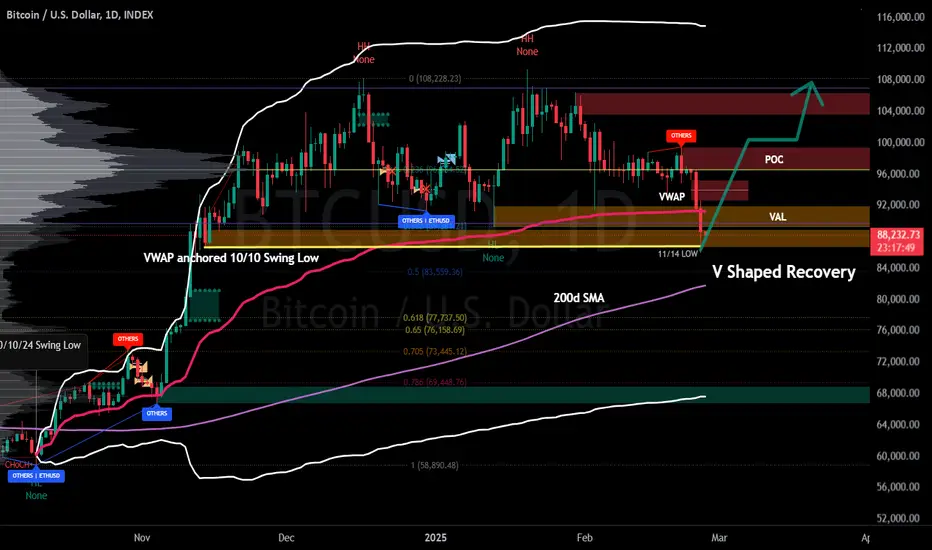
BTC Price Target #3: The Bullish Case, V-Shaped RecoveryImplausible without a positive catalyst and a return of interest in 'Risk On':
A V Shaped recovery of price action, reclaiming the value area in question, support of the VWAP and POC, essentially reversing the dump begun 2/21 with the curiously timed revelation of the Bybit hack...
Should price action *rapidly* reclaim GETTEX:97K --or, better yet, $99.8K--and confirm the recovery with a Daily close above, the supposed post-halving bull run would be on again. For now...
Such an outcome would be consistent with an (arguable) Double Bottom--if not #JTTW.
Whats next after the Bitcoin correction In this video I Breakdown a couple of potential Targets for longs .

$SWARMS ANALYSIS! $SWARMS is testing the red resistance zone 🟥.
✅ If breakout is successful, the first target is the green line level 🟩.

BTC BREAKOUTA preliminary look at the ongoing--perhaps engineered--collapse since the Bybit cold wallet fiasco...
The retracement to the $90K range, expected by many, from the ATH of 1/20 finally seems to have broken price action out of the prolonged compression in which has been stuck for over a month now. Where it's far from over, a couple of things stand out.
Presuming price action doesn't continue past the wick to just under GETTEX:87K in the next two days (time of writing: 14:00 UTC on 2/25), we could be looking at an interesting Double Bottom formed with the low of 11/14/24.
Given the loss of GETTEX:92K , we can fairly conclude that BTC has fallen back into a greater volume profile, one I have anchored here at 10/10/24, a prominent Swing Low. Bullish case : price action moves back quickly over the VAL and regains support over the value area POC and VWAP.
Bearish case : Price action is rejected at the VAL and continues to the next level of support. (High 70's? A retracement to $77K would fill the noteworthy CME Gap in that area.)
What ultimately makes or breaks the case for a 2025 Bull Run for BTC and crypto is a resumption of the interest in space that has characterized previous Post-Halving Years. That has been lacking so far in 2025.

February 21 Bitcoin Bybit chart analysisHello
It's a Bitcoinguide.
If you have a "follower"
You can receive comment notifications on real-time travel routes and major sections.
If my analysis is helpful,
Please would like one booster button at the bottom.
Here is the Bitcoin 30-minute chart.
Nasdaq indicators will be released at 12 o'clock shortly.
Nasdaq is moving sideways in the 6+12 pattern
From the Top section to the Good section at the top,
It is the resistance line of the Bollinger Band daily chart.
(Best short entry section)
I created today's strategy with the important conditions above.
* Conditional long position strategy when the red finger moves
1. 98,332.5 dollars long position entry section / cut-off price when the green support line breaks
2. 99,740 dollars Top section long position 1st target -> Good 2nd target
The target price at the top is important.
By 9 am tomorrow morning when an additional daily candle is created
If it reaches the Top-> Good section
After long profit taking, short position switching -> long position is autonomous
I think it would be good to look at the final 1+4 section.
(Currently, 1st section, around 97875.5 dollars)
After finishing today with an upward sideways movement
If it reaches the top section tomorrow,
You can continue to maintain a long position by modifying the stop loss price.
Refer to Great -> Miracle at the top.
This part is a strategy based on the shape of the resistance line on the daily chart.
If it deviates from the current position,
The bottom section becomes the 1+4 section
And then the 2nd section
Please check the shape of the support line on the daily Bollinger Band chart over the weekend.
Please use my analysis so far for reference and use only
Thank you for your hard work this week.
Thank you.

Bitcoin's Balancing Act: Consolidation, Theft, and Market ForcesBitcoin continues to consolidate in the 90k - 106k area! Recently there was an act of theft from the ByBit cold wallet, resulting in over $1.5 billion worth of ETH being stolen. This is definitely a negative backdrop, we have seen good support from other exchanges and crypto project funders. Theoretically, it would be possible to roll the chain back as Arthur Hayes suggested, but it doesn't seem to be possible, although it would definitely play in favor of the bulls. I would expect a drop to the $91800 area for several reasons:
1. Bear dominance. This can be seen in the bullish and bearish volume indicator. Bullish volumes have fallen while strong sales volume growth is noticeable.
2. Elliott Wave Correction
3. BlackRock sold 3,283 BTC before the ByBit hack and has yet to buy more.
4. According to the smart money concept, 92400-91200 is a magnet.
5. Need to liquidate a large number of long positions that gained momentum after leaving the 99k level.
Horban Brothers.
Did the Bybit Hack Fuel Ethereum’s Rally? Ethereum has been holding strong while Bitcoin wavers. Despite BTC slipping below $96,000, ETH has managed to stay above $2,700, showing resilience against broader market weakness. But with volatility rising and a massive $1.5 billion Bybit hack, questions arise: Was Ethereum’s price surge an artificial move, and is a reversal ahead?
A Short-Term Rally or the Start of a Major Move?
Ethereum’s price made a strong attempt at $2,900 but failed to hold, leading to a drop back below $2,700. The key ascending trendline, which has acted as support for five months, is now being tested.
Bearish Signs Emerging?
The CMF (Chaikin Money Flow) dipped below 0, signaling weakening buying pressure.
DMI indicators deviated, failing to confirm a bullish breakout.
A bearish candle formed after rejection at $2,900, hinting at possible further downside.
Critical Levels to Watch
📌 If ETH holds above $2,650, a rebound toward $2,772 resistance could be in play.
📌 If ETH fails to defend the trendline, support at $2,567-$2,541 could come into focus.
Ethereum’s fate will depend on whether buyers step in to defend support or if bearish momentum takes control. For now, the bullish narrative isn’t over, but signs of fading momentum are hard to ignore.

24/02/25 Weekly outlookLast weeks high: $99,474.13
Last weeks low: $93,399.17
Midpoint: $96,436.65
Fear & Greed Index: 49
Despite dull price action there is never a dull moment in crypto... BYBIT exchange was the victim of the largest crypto hack in history with $1.4B worth of ETH being stolen.
How does this event relate to price? On the grand scheme of things not much, which is surprising but what this sell-off does in terms of structure could be much more harmful IMO. Just as ETH broke through a key S/R level of $2780 the hack occurred sending ETH back under that level and a market sell off due to fear and risking-off. Had Ethereum accepted above that key level structurally the setup looked primed for a move to $3200. Not only that but BTC has broken above weekly high and looked to flip the 4H 200 EMA. These levels are so important to both coins and the timing of the hack cannot be understated.
Looking at this weeks chart we find ourselves in the same spot for the 3rd week in a row, $96,000 has been the starting point and midpoint emphasizing the choppy nature of the market and compression of price. The question is which way will BTC expand once this trend breaks, to the upside or to the downside?

Ethereum (ETH): Still Holds Bullish Trend Line!We had some choppy moves on Ethereum recently thanks to the Bybit hack.
Nevertheless, that dip got bought up very quickly and buyers are still maintaining the local support zone, which is a very strong one, as we have talked previously. Combined with EMAs sitting at that area, this is a good buying zone for sure.
Now the current weekly candle is showing some weakness but we are not going to judge yet as it is just the start of the week!!
P.S. As long as we are above EMAs, we are good for long!
Swallow Team

Trump's Golden RatioTrump has launched his own personal token that he will use solely for his own benefit for bribes and money laundering. He's not a politician, he's a businessman who knows how to make money. Creating his own cryptocurrencies is direct proof of that. The $TRUMP token plays a role as the president's personal token for the Republicans to donate to him and a legal way to get money from other politicians. The whole saga with his token is just beginning, it is one of the few steps in building the Trump family the greatest business ever.
As far as the chart is concerned, we should wait for a bounce into the golden section area. Now there was a FUD regarding the ByBit hack, it's like a fake attempt to panic the crowd, but it didn't work with smart people. Only the strongest are left here, who have survived everything they can.
Horban Brothers.


Ethereum URGENT!!! Bybit got hackedEthereum URGENT!!! Bybit got hacked
someone stoled 1.5B in ETH from Bybit
what do we plan the next??
watch now

Story Coin ($IP) Surges 122% Before Sharp Dip: What’s Next?Story Coin ( NYSE:IP ), a newly launched token, made headlines with an impressive 122% surge, only to experience a sharp 50% retracement shortly after. Despite this volatility, the asset has found a new support zone, suggesting potential for a renewed uptrend.
Technical Outlook
At the time of writing, NYSE:IP is down 19%, reflecting a cooling-off period after its parabolic move. However, the Relative Strength Index (RSI) sits at 47.74, indicating that selling pressure is decreasing and another breakout could be on the horizon. The stabilization of NYSE:IP aligns with its recent listing on major exchanges, including Bybit, adding to its credibility and liquidity.
What Makes Story Coin Unique?
Story Coin is built on a Layer 1 (L1) blockchain designed to revolutionize intellectual property (IP) management on the internet. It enables creators to seamlessly register, license, and monetize their IP assets through blockchain technology, ensuring transparency and efficiency.
Market Developments and External Factors
One notable market event impacting sentiment is the recent Bybit exchange hack, where $1.4 billion in ETH and stETH was reportedly stolen, according to blockchain investigator ZachXBT. While this incident does not directly affect NYSE:IP , it underscores the importance of security and trust within the crypto space.

February 19 Bitcoin Bybit chart analysisHello
It's a Bitcoinguide.
If you have a "follower"
You can receive comment notifications on real-time travel routes and major sections.
If my analysis is helpful,
Please would like one booster button at the bottom.
Here is the Bitcoin 30-minute chart.
There is no Nasdaq index announcement today.
At the bottom left, the purple finger
connected the 2nd section yesterday, 94,142 dollars
final long position entry section.
*In the case of the sky blue movement path
It is a two-way neutral strategy.
We focused on the final long position.
1. 97,550.5 dollars short position entry section / cut-off price when the orange resistance line is broken
2. 95,743 dollars long position switching / cut-off price when the green support line is broken
3. 98,526.5 dollars long position 1st target -> Great 2nd target
If there is an immediate adjustment from the current position
The 1st section (95,085.5 dollars) at the bottom is the long position waiting section.
The bottom section is today's major rebound section.
Up to this point, I ask that you simply use my analysis for reference and use only.
I hope that you operate safely with principle trading and stop loss prices.
Thank you.
