GBPUSD - Is it time to FADE?WEDNESDAY - Half way through the week!
GBPUSD - I like the long side for GBPUSD for months. It's a great trade that has had great momentum, I stuck to my trade plan, being disciplined is key and built long positions along the way - I am now scaling out of my positions!
On my FX weekly I posted out to various groups I am part of - It's FREE to subscribe. It's explaining the FX majors for the week ahead, if you're interested - Message privately.
I stated GBP above 1.37 you'll get 1.38 coming into play as well as perhaps 1.40 areas...However, for those who have been trying to fade GBP for while, You may just get your chance...Let me explain further!
Technical Aspects:
Pattern: Channel - At resistance
Fib Retracement - Fade Area
Support: 1.37830, 1.37580, 1.37370
Resistance: 1.38250, 1.38550, 1.38600, 1.38860
Fundamental events:
1. US CPI
2. BOE Gov Bailey Speaks
3. Fed Chair Powell Speak
How could you play this trade:
- Following your own trade plan to add further confluence
- You could wait for candle formation, candle close, bearish pattern or perhaps an indicator that is on your trade plan
- Add orders at certain resistance zone areas
Have a great day ahead,
Trade Journal
(Disclaimer: Just a trade idea, not a recommendation)
Cable


GBPUSD - WEEK AHEADSo the Bullish TL from the March lows is still firmly in tact. But we need to break this resistance to push higher. The first target is pretty obvious, with the psychological 1.40 but technically, the first resistance after it breaks here is 1.44.
Pull back area for the corrective sells also could be valid with sells below the 23.6% Fib level showing a valid break of this consolidation.

GBPUSDConfluences:
- Generally strong support and resistance zone formed
- Expecting a push to the 1.375 resistance zone
- Once we see a rejection at the 1.375 level we will look to sell at 1.373

GBPUSD INSIDE BAR BREAK UPGBPUSD on the 4h chart is making inside bar, an inside bar on the 4h chart basically represents a 1h consolidation, so you look for price to break the previous candles high and you place your stop beneath the inside bars low. these offer great risk reward and usually fast impulsive trades, so fingers crossed

Rangebound in a bull run#GBPUSD: The range bound action in an ascending channel is expected to break upwards. With the bias remaining bullish, preference is to buy the dips with stops below the invalidation level 1.3520

Cable Explodes following BOEComments from the BOE meeting this morning
1. CPI inflation is expected to rise quite sharply towards the 2% target in the Spring.
2. Other indicators suggest that Labour market slack has remained higher than implied by the LFS rate.
3. CPI inflation is projected to be close to 2% over the second and third years of the forecast period.
4. A further increase in unemployment is projected over the next few quarters.
5. The average weekly earnings growth has been notably stronger than expected in the November report.
6. See UK GDP +5% in 2021 (Nov. projection: +7.25%).
7. BoE sees UK GDP +7.25% in 2022 (Nov. projection: +6.25%).
-------------------------
Please don't forget to FOLLOW, LIKE, and COMMENT ...
If you like my analysis:)
Trade Safe - Trade Well
Regards,
Michael Harding 😎 Chief Technical Strategist @ LEFTURN Inc.
RISK DISCLAIMER
Information and opinions contained with this post are for educational purposes and do not constitute trading recommendations. Trading Forex on margin carries a high level of risk and may not be suitable for all investors. Before deciding to invest in Forex you should consider your knowledge, investment objectives, and your risk appetite. Only trade/invest with funds you can afford to lose.

GBPUSD - My humble analysis 👑🇬🇧💂In this video i go through the chart and my personal experience with the GBP and how it affected my life negatively in 2007 (first drop got me out of real estate) and positively during the Brexit (I got my money back, thank you trading).
Today will be a volatile session for pound sterling, trade with care people.

GBPUSD - Things could take a turn...!!Happy Tuesday...Here's a free Cable trade idea...!
I got asked why do I give my trade ideas for free?
It's my passion I live and breathe the markets, I know there's so many scammers out there and capital isn't what I am greedy for ever - but giving the community a guidance to help build confidence for your trading journey is the best gift I could give anyone. This will always be free!
GBP - You know for ages if you are an active follower of mine - I am bullish GBP you probably even know my target areas longer term perspective and 1.50 it could go to. However, for now I am really keeping an eye on this formation we have built.- Dollar squeeze could be coming soon....!
Fundamentally:
- BOE Monetary Policy Report (Thursday)
- Negative Rates - I highly doubt its needed
- Positive vaccine roll out
Technical aspect:
Wedge has been formed a break to either direction.
Support: 1.37570, 1.36585, 1.35520, 1.35240
Resistance: 1.37100, 1.37600, 1.38070, 1.38940
Ways you could the trade GBP:
- Wait for the break out and trade the pull back
- Add orders either directions
- Go to a smaller time frame to get into an early position if you're feeling confident
- Follow your own trade plan for further confluence
Key tip: Patience & Discipline.
If you have any questions, message privately happy to help.
All the best,
Trade Journal
(Just a trade idea, not a recommendation)

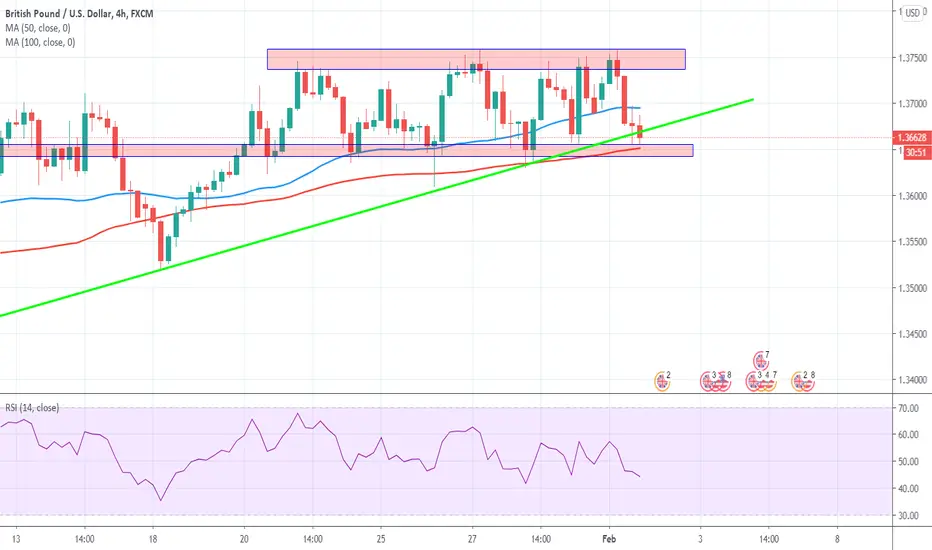
GBPUSD - PRICE BOUNCELooking at Cable, price has been bouncing between the Support and Resistance Zone for the last few days.
We are also seeing price sat on the Support currently, we will wait for confirmation of a broken trend before entering.
Key points to take from the analysis;
1. Price is sitting at a key support zone (1.3650)
2. Stochastic Indicator is showing the market is Oversold on the 1hr charts
3. We haven't see the 50 day Moving Avergage cross over the 100 day Moving Average.
I believe we will see a continuation of the Ascending price, if the market breaks the Support, we will look to enter a Short Sell.
My thoughts are a short term Long with a follow up Sell Off in next day or two.
GBPUSD SHORT analysisthe price has again rejected off the boundary while USD is still rising with bullish englufing candle being formed.
we can initiate a sell here till
tp 1. 1.3660
tp 2. 1.3634
tp 3. 1.3580
Stops at 1.3810


GBPUSD PREDICTIONVery bullish personally but as always we have both routes planned.
Chart explains everything, 4hr close above resistance and we're in.

GBPUSD breakout imminent the week of 01 Feb 2021Recent price action on this pair has been choppy but grinding higher all the time. As my weekly chart (below) shows, the 1.3750 area has become a barrier that price has been unable to overcome since end Apr 2018.
Back to the H4 view, let us examine price action for the last 10 days. We can see a series of higher lows, while the highs have remained consistently capped in the 1.3750 region. I see this PA as a squeeze in progress. I am expecting that the bears will weaken while the bulls will grab a better control of the market during the next few days. I am watching with a bullish bias, expecting price to impulsively break out to the upside sometimes in the coming week, while also keeping an eye on DXY.
For trade location, an aggressive entry would be when breakout occurs, while a conservative approach would be to wait for a retest of the breakout line. The region around 1.4000 would a good choice for the initial target, while 1.4350 is certainly possible for the patient trader.
If my analysis is correct, we could have a nice Multiple R trade either way.
If you like my analysis please give it a “thumbs up” and follow me to get immediate notifications.
As always, please use sound money and risk management in all your trades.

GBPUSD shortonly if the PA breakout , PT 1.3460 , no SL , as soon as there is pull back up to the support (also back to the channel again) then close it.

ridethepig | EURGBP Finding a Floor📌 ridethepig | EURGBP Finding a Floor
After the preparatory manoeuvre, passive sellers are keeping a close eye on the 0.882x ABC target and already starting to cover. Sharp Buyers were aware of this and made the transition to attempt a base formation. With ECB / FED now cleared there is the customary inventiveness to continue with the rally. What we are trading here is the expectation of BOE cuts and calling bluff on ECB holding pattern.
On the GBP side, we have been given a data from Johnson for March where kids will return back to school. Taking it with a pinch of salt once more and recommend resisting temptation to park in GBP. BOE has room to cut rates and with Brexit impact starting to enter into play, the flows will become clearer. Technically taking 0.893x will open the floodgates for a momentum gambit towards the highs, while to the downside 0.887x/0.882x area will continue to be the loading zone.
Thanks as usual for keeping the feedback coming 👍 or 👎

GBPUSD SHORT GBPUSD -Short prediction to the Last week low
Weekly high already in place
Smart Money at the Last week Low
Month End is good reason to sort the market 40-50%
comment and follow my ideas
Thank you


Expecting GBPUSD To Rally From Here! BUY GBPUSDHi traders, we have a potential long opportunity here on the GBPUSD based on a 123 strategy (middle line reversal).
Good Luck Traders

A Gift From ME To You! BUY GBPUSDHere we have the pound at a support level which i expect it hold and give us a move back up into previous structure. This is a simple technical analysis that doesn't any further explanation.
Good luck traders

Successful Short Trade (BOOMER Market)Cable (British Pound Sterling , GBPUSD ) is in an obviously beautiful BOOMER market, accelerating North!
During an Uptrend market like this is, one of the wise things to do - is to ride the wave, buying on dips.
As per the CONDI Trading System rules, the only trading allowed in this setup is (strictly!) with the trend.
T.m. only taking Long trading opportunities, 100% confirmed by the CONDI Trading System.
Recognized (yet another) such opportunity at point marked with the callout.
Trade successfully closed with profit within 9 1h candles.
Happy CONDI trading!

GBPUSD opportunityPrice reached and strong daily chart resistance near 1.38. A break above would indicate probable target levels at 1.40 and the potential to continue higher.
The end of uncertainty with Brexit seems to have put more faith in GBP.
Good Luck and Stay Healthy!

GBPUSD retest on Resistance ... againBullish momentum still intact as of now.
Do not short until the buying momentum fade away.
