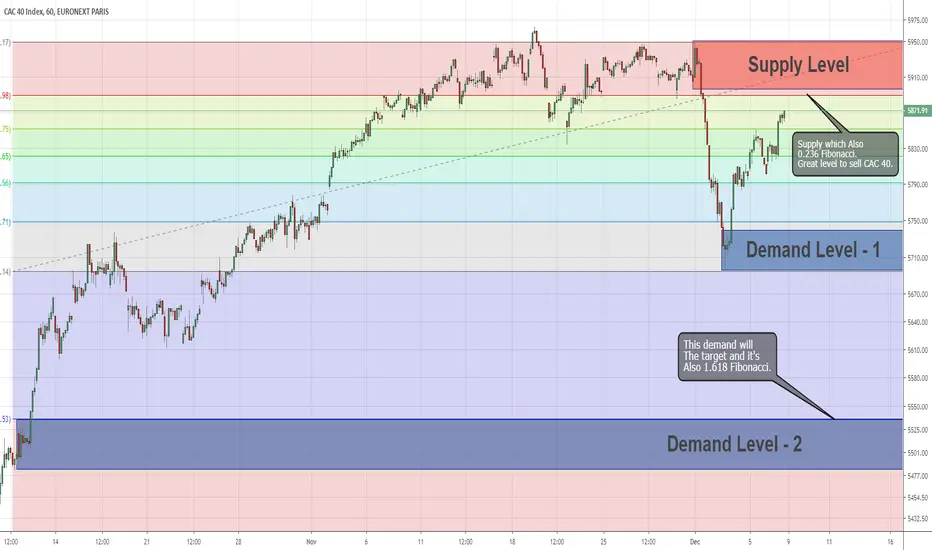
CAC40 Index: Fibonacci Level Combined With SupplyThe price creates a fresh supply above which also 0.236 Fibonacci level of the last drop in the price.
It is a great level to sell CAC40 Index on the first touch,
The first target will be demand - 1 and the final target is demand - 2.
CAC 40 CFD
US could impose 100% tariffs on French goods after Google taxWhat was President Macron thinking about designing a tax for tech companies... A quick reminder, it will be separated in two categories — marketplace (Amazon’s marketplace, Uber, Airbnb…) and advertising (Facebook, Google, Criteo…). Despite the fact it wasnt planned specifically for American companies, the vast majority of big tech companies that operate in France are American. Thus, a company that generates more than €750 million in global revenue and €25 million in France, will have to pay 3% of the French revenue in taxes.
As expected, the U.S. Trade Representative claimed that“France’s Digital Services Tax (DST) discriminates against U.S. companies, is inconsistent with prevailing principles of international tax policy, and is unusually burdensome for affected U.S. companies.” And, as a result, now we might see tariffs that could be as high as 100% on French goods (wine, cheese, handbags…).
What is going to happen now? Frnce will say that the response will be equally damaging, but i personally doubt they manage to impose significant tariffs unless the whole European Union agrees to cooperate and istart acting. However, even in this case no one can guarantee that th EU will achieve something worthwhile... So, with a high probability we will see another decrease in the Cac-40.


New Bubble ?The CAC 40 is trading near new high at 5730 after breaking a major resistance at 5650 becoming now a support, the trend is Bullish but the question is how far can we go in this new bubble ?
5800 ? or more or we will come back to 5650 ?
so my strategy is to wait for a close above 5700 to go long to target 5760 -5770
but if we close below I am neutral till the break of 5650

TRY ENTER SHORT AROUNT 5775-80 for 3 tp short timeshort #CAC40 at 5776 if you cant catch it,try tom around 70-80 and sell,the plan its simply to take the correction of a bearish rsi divergence + we are on monthly resistance and a bit overbought so 3 Tp like that each tp you cut 33% of your position


a bearish chanel forming on us indicesjust a simple a view of a bearish chanel on sp500 it can be use as signal or entry point.
i draw a basic chart for it been clear


CAC 40 NEW HIGH the CAC 40 break a major resistance at 5660-65 and trading now at 5690 making new high , I think that this push might continue and we will reach 5700-5730 soon unless some Geopolitical issue or Tweet over the trade war is made
You can go long to try target 5730 but for me I will Wait to short because the uptrend dont have very much way to go

Cac 40 Bear Trap ? new high or correction ?The CAC40 is on a bullish trend but show some weakness trying to break the resistance at 5660-5665 but it is so obvious that I might think that is a bear trap and we could make new high trying to reach 5700-5730 before starting a correction so for now my strategy is to wait for a better signal to short

CAC40 - Potential Breakout on Cup & HandleINDEX:CAC40
Very interesting phase in the basket that contains the first 40 French companies per market cap, or the CAC 40.
The 17-year bearish trendline was broken 2 years ago and the bearish trendline has already supported it three times and now a Cup & Handle has been formed that could break out next week and become a potential asset to enter.

Short signal possible, #CAC 40 Index Serious resistance In 5642, 3 serious attempts failed.
Stochastic Overbought.
Despite the rise of the Cac40, there are some signs (written above) of possible price correction.
Target: 5470

CAC40That is a very good question regarding CAC40. The price gives us a bearish signal. As the price is around the resistance level which is also around 61.8% fib lvl of the original drop. Since the trend-line established Dec 2018 broken, we can consider this rising wedge as a correction. But what if it doesn't happen as we planned? The backup plan is also included.

short 5501 and tp 5440 as last gap is filledlast gap filled ,next step back on dsupport if need an impulsion to go more up or to crash, will depend on us-china headlines

CAC40 Fails to make New All Time HighsThe French CAC40 has struggled to break above the resistance zone into all time new highs. The ECB has promised cutting rates further negative and more stimulus...we shall wait to see the developments, but so far the markets have already priced that in and sold off today after the announcement.
The CAC40 on the 4 hour shows 2/3 market trends. We had an uptrend with well defined higher lows and higher highs, and now we are ranging. On the current candle, we had a fake out with the wick above, and the bears are stepping in.
Await for a break of the 5535 zone before entering a short. See how strong the candle break is and we can assess the trade when that happens.


CAC40 - Indices Trading | Elliott Wave Structures | Q2 2019*Please support this idea with a LIKE if it helps you. Thanks!
More details about me in my signature.
CAC40 - Elliott Wave Outlook
Bearish Swings - Patterns:
Triple Three structure in Cycle Wave IV (green)
W (purple) - Zig-Zag
X (purple) - Three (false break-out)
Y (purple) - Simple Flat
X (purple) - Contracting Triangle
Z (purple) - Zig-Zag
Bullish Swings - Patterns:
Impulse in Intermediate (1) (blue)
Extension in Minor 3 (green)
Next expected swing:
Bearish sequence in Intermediate (2) (blue)
Structure change:
Bullish continuation in an impulsive manner could lead towards more up-side for an Ending Diagonal.

SHS CAC40 4H/1DSHS on 1D near to break down. Just did a pull back to upper side of bearish directrix today leaving a 4H bearish candle and way to live it in 1D also. It could break down soon this week.
Likely to go down until 0.618 fibo retracement (around 4950). I would set sl at around 5415.

CAC 40: Very strong long term upside potential. 6700 on sight.CAC is quite strangely printing on the big 1W/1M time frames a similar trading pattern with the early - mid 90s. The MA50/200 sequence is identical within a Channel Up with two distinct peaks that broke the Channel momentarily before testing again the supporting trend line.
What stands out in particular is the +46.50% rebound from the first Higher Low on both cycles. What follows after is a giant Inverse Head and Shoulders pattern, which gave rise to the second peak outside the Channel Up.
CAC40 is currently on that Inverse Head and Shoulder pattern attempting to price the Right Shoulder.
With such striking similarities it is only natural to assume that the current cycle will follow to a large extent the 90's cycle. Which means that after the Inverse Head and Shoulders is completed a +49.50% rise may follow (second peak outside the Channel) bringing the index close to 6,700. This is our long term target for CAC and the candle action times this by March 2020. After that the final Higher Low takes place which should pave the way for the new hyper aggressive cyclical bull market similar to the late 90s - 2000.
** If you like our free content follow our profile (www.tradingview.com) to get more daily ideas. **
Comments and likes are greatly appreciated.

CAC40 - Market Crash Cycles | Indices | Macro Trends*Please support this idea with a LIKE if it helps you. Thanks!
More details about me in my signature.
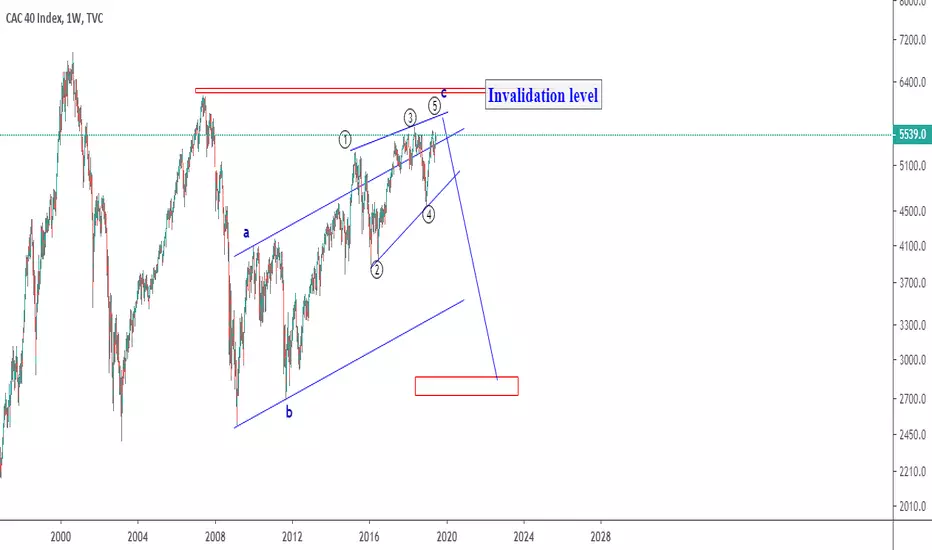
CAC40 has been labeled within a Sub-Millennium degree wave 4 (blue), which has been unfolding ever since the Dot-Com bubble.
Structure - Flat Formation
2000 peaks and down until 2003 bottoms - Grand Super-Cycle wave A (black)
2003 bottoms up until 2007 tops - Super-Cycle wave (a) (purple)
2007 tops and down until 2009 lows - Super-Cycle wave (b) (purple)
2009 lows and up until present times - Super-Cycle wave (C) (purple)
Super-Cycle (C) (purple)
Pattern - Ending Diagonal
Sequence - 5 Wave Sequence, with Cycle Waves I II III IV V (green) decomposed as Primary ABC (turquoise)
Current Position
Cycle Wave V (green)
Next expected swing
Bearish sequence in Primary B (turquoise)
Market Crash Forecast
Support granted at or around the 5300.00 mark and then a bull run towards the 6300.00 levels, where the Grand Super-Cycle Wave B (black) is expected to complete.Grand Super-Cycle Wave C (black) would reflect the next Larger Degree Recession.Structure change.
Breach of the lower trend-line of the Ending Diagonal could reflect the fact that the Market Crash already started.

CAC40 - Indices Forecast - Wave Patterns - Volatility in MayIf you like this idea, please support it with a like. Thank you.
CAC40 labeled as a bullish impulse in Intermediate (1) (blue), with a deep bearish retracement starting.
