Uptrend in CADJPYWe are currently in a very good looking uptrend that is gathering strength to continue. The last part of this trend starts from the middle of the previous month. Current levels are important, where the price meets resistance from the daily chart.
However, it seems that there will be strength to break and reach the following resistances:
81.85
82.05
82.27
You can enter now or wait for it to break. In both cases, the idea is fail by breaking the previous bottom.
If you have questions about how to trade this or another situation, contact us!
To support us, like and comment! comments!
Cad-jpy

Cad/Jpy Ready For a Nice and Sweet Sellits near the dynamic resistance line in the weekly timeframe and also the static resistance line in Daily Timeframe.
if The PMI News Comes Bad for CAD Sell position is confirmed.
it is safer to enter when the short uptrend line got broken.
share your ideas with Me :)

CADJPY is approaching support | 7 Dec 2020Price is approaching support where we could see a bounce above this level to our first resistance target. Ichimoku cloud is showing signs of bullish pressure as well.

CADJPY is approaching support | 7 Dec 2020Price is approaching support where we could see a bounce above this level to our first resistance target. Ichimoku cloud is showing signs of bullish pressure as well.

CADJPY Short Longterm CADJPY is currently in a large rising triangle structure on the 4hr chart.
Price has the potential to break out of structure. should this happen, we would be looking for bullish opportunities after a retest of previous resistance.
However I am currently bearish till this happens.
Watch for break of smaller rising support within triangle for short opportunities down to the larger rising support.
RSI is showing bearish diversion on the 4hr.

CADJPY Buy on BreakoutCADJPY completed ABCDE correction and will continue completing the move upwards. Bearish for USOIL

USD gains broadly as stocks consolidate gains...USD gains broadly as stocks consolidate gains; ADP jobs at 8.15.
CAD steadies around mid 1.29s with flat crude oil.
EUR drops to mid 1.20s as UK trade risks linger.
GBP falls sharply as Barnier warns of no trade deal.
JPY reaches one-week low as move away from safety extends.
AUD supported by better than expected Q3 GDP.

CADJPY - SWING - 30. NOVE. 2020Welcome to our weekly trade setup ( CADJPY )!
-
1 HOUR
Bullish takeout, expecting a turnaround shortly..
4 HOUR
Price too high imo, great short entries!
DAILY
Overall Sideways moving market structure, looking for another push to the downside.
-
FOREX SWING
SELL CADJPY
ENTRY LEVEL @ 80.230
SL @ 80.420
TP @ 79.380
Max Risk. 0.5% - 1%!
(Remember to add a few pips to all levels - different Brokers!)
Leave us a comment or like to keep our content for free and alive.
Have a great week everyone!
ALAN

CADJPY bounce or break? keep an eyeif price bounces off my level and makes a higher high i will be looking long. if it breaks and retests then ill be looking short. no bias at the moment, remain neutral

cadjpy daily analysiscadjpy retraced from 1.618 fibonacci on daily chart we can see a clear doji exactly on this fibo level and i excpect a trend continuation for this pair
please if you like my analysis click like buttom follow me and share my charts with your friends
CAD/JPYCADJPY formed a falling wedge in the upward trend. Now the price in the support zone is accumulating near the 61.8% Fibonacci level.
Best regards EXCAVO

CADJPY WEDGENot the best week really for me, no major losses but lack of set ups, so i have noticed this wedge structure in cadjpy and i am in a long position aiming for the 81 kinda area. 4h looks like swing low, just need a bit of oil bull

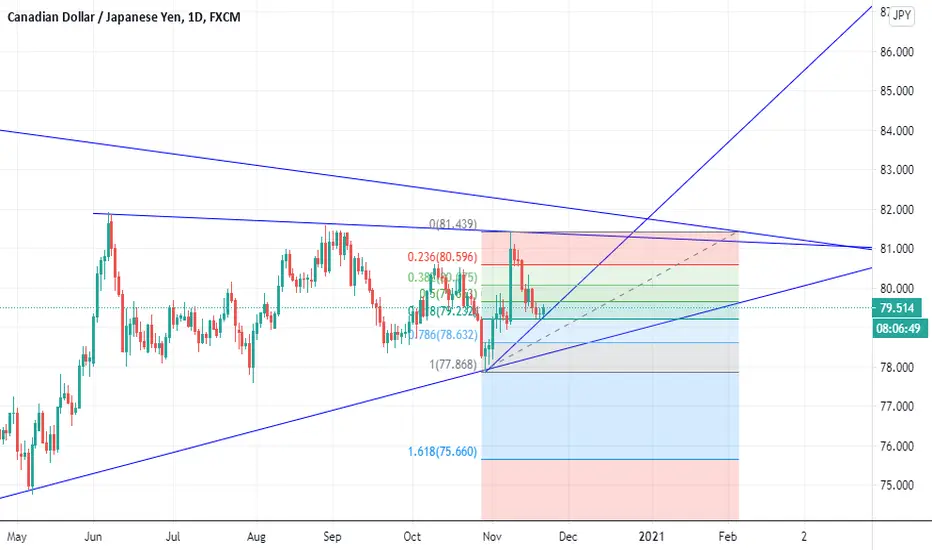
CADJPY looking for the 0.786 🦐CADJPY after the attempt to break above the weekly resistance structure at the 81 area created a descending leg.
The price bounces over the 0.618 fib retracement at 79.650 before moving to the 0.786 level at the daily support.
IF the price will bounce over the 79 area and give us a sign of inversion we will set a nice long order according to Plancotnbs' strategy.
--––
Follow the Shrimp 🦐
Keep in mind.
🟣 Purple structure -> Monthly structure.
🔴 Red structure -> Weekly structure.
🔵 Blue structure -> Daily structure.
🟡 Yellow structure -> 4h structure.
⚫️ Black structure -> <4h structure.
Here is the Plancton0618 technical analysis , please comment below if you have any question.
The ENTRY in the market will be taken only if the condition of the Plancton0618 strategy will trigger.
Leave a comment that is helpful or encouraging. Let's master the markets together.

CADJPY H&SHead and shoulders and a downtrend continuation bearish triangle + elliott triangle waves
Good luck and follow me for more


CADJPYTF: 15 min
Looks may want to continue down, I am keeping my eye on the break of the structure shown


CADJPY bounces over the 0.618 🦐CADJPY on the daily chart is close to a weekly resistance.
The price after an attempt to break above retraced until the 0.618 fib level and now testing the 0.5.
IF the price will break and close above the structure at the 80 level we can set a nice long order according to Plancton's strategy.
--––
Follow the Shrimp 🦐
Keep in mind.
🟣 Purple structure -> Monthly structure.
🔴 Red structure -> Weekly structure.
🔵 Blue structure -> Daily structure.
🟡 Yellow structure -> 4h structure.
⚫️ Black structure -> <4h structure.
Here is the Plancton0618 technical analysis , please comment below if you have any question.
The ENTRY in the market will be taken only if the condition of the Plancton0618 strategy will trigger.
Leave a comment that is helpful or encouraging. Let's master the markets together.

CAD / JPY Will Going UP !! Great Entry + ReasonsHi Pro Traders ♥
Let's Look To Chart And See What Will Happen For Cad / JPY !
Our Vision IS : ♦ Buy ♦
When ? Now 79.800
Why Sell ?! I Will Tell You
Reasons To Sell :
🀄️ Break Trend + Test + Support Area ( 1 Hour )
🀄️ POC Area
Then When We Can Sell ?
-- Now 79.800
See You After Take Profit Done ♥

💡 Don't miss the great buy opportunity in CADJPYTrading suggestion:
. There is a possibility of temporary retracement to suggested support line (79.8). if so, traders can set orders based on Price Action and expect to reach short-term targets.
Technical analysis:
. CADJPY is in a range bound and the beginning of uptrend is expected.
.The price is above the 21-Day WEMA which acts as a dynamic support.
. The RSI is at 66.
Take Profits:
TP1= @ 80.30
TP2= @ 80.60
TP3= @ 81.00
TP4= @ 81.43
TP5= @ 81.90
SL= Break below 79.4
❤️ If you find this helpful and want more FREE forecasts in TradingView
. . . . . Please show your support back,
. . . . . . . . Hit the 👍 LIKE button,
. . . . . . . . . . . Drop some feedback below in the comment!
❤️ Your Support is very much 🙏 appreciated! ❤️
💎 Want us to help you become a better Forex trader ?
Now, It's your turn !
Be sure to leave a comment let us know how do you see this opportunity and forecast.
Trade well, ❤️
ForecastCity English Support Team ❤️

CADJPY WEEKLY TIMEFRAMESounds likely to decrease in weekly timeframe although I see an increase for this pair in 4h timeframe, logically enough we will get ready to go for the sell position.

CADJPY - 2 WEEK LONG TERM - THE (COVID SH*T) SHOW MUST GO ON.This is a long term projection
I know it sounds crazy but by the look of it, banks are predicting that this covid situation will continue longer than we expect ... or if it's not covid, it will be something else that will affect the market.
This is my prediction.
Whatever you do, do risk management properly.
stay safe folks :)
