CADJPY is approaching a significant zoneHey Traders, in today's trading session we are monitoring CADJPY for a buying opportunity around 112.300 zone, CADJPY is trading in an uptrend and currently is in a correction phase in which it is approaching the trend at 112.300 support and resistance area.
Trade safe, Joe.
Cad-jpy

📈 CAD/JPY Review 📉📈 CAD/JPY Review 📉
CAD/JPY saw a notable rise last week, reaching the previous week's high before encountering resistance, forming a compelling setup in lower time frames. 🚀📉 Target levels are clearly outlined on the chart, with focus shifting towards last week's low. 🎯 Overall, a promising opportunity seems to be brewing in the CAD/JPY pair. Keep a close eye for potential entry points! 💼💰 #TradingView #ForexTrading 🌐

CADJPY Triangle break-out buyThe CADJPY pair delivered us a very strong buy opportunity last time we made a buy call on it (December 22 2023, see chart below) :
Moving back to the 1D time-frame, the pair has been trading within a Channel Up pattern since the December 07 2023 Low. Currently on its 2nd Bullish Leg, the price has entered a Triangle consolidation, similar to the pattern of January - February.
So far the fractals appear to be quite identical as following a +3.34%, the price pulled-back to the 0.382 Fibonacci retracement level, which is at the moment holding. As long as it continues to do so, we expect a bullish break-out similar to February's towards the -0.382 Fib extension, hence our Target is 113.500.
-------------------------------------------------------------------------------
** Please LIKE 👍, FOLLOW ✅, SHARE 🙌 and COMMENT ✍ if you enjoy this idea! Also share your ideas and charts in the comments section below! This is best way to keep it relevant, support us, keep the content here free and allow the idea to reach as many people as possible. **
-------------------------------------------------------------------------------
💸💸💸💸💸💸
👇 👇 👇 👇 👇 👇

GBPCAD: Strong start for GBP fading out?GBP has been the strongest performing currency so far this year - I keep asking myself why??
Country in a recession
Stagnant economy
Limp Central Bank
With today's unemployment reading I'm expecting this to be the start of bearish involvement in sterling, I'm starting with this pair.
Think oil has dropped a lot and could be ready to bounce up which is good for CAD.
Seem to have broken the ascending trendline and retesting it now, failure to break back in will signify a change in direction.
My first target is 1.708, around the MA50 (daily) and clear support.

CADJPY: Next stop the monthly falling trendline?There's not much in the way of this move from what I can see.
Yen continues to be the weakest currency in the G10 (for now, BoJ look set to intervene at some point this year) and for the short term I expect this to continue to meet the descending long-term trendline that's formed.
I'll be looking for sells around 115 with any LTF confirmation, but until then I'm going to be doing some long scalps not that local resistance has been broken and retested.

Sell CADJPY Bearish Channel The CAD/JPY pair on the M30 timeframe presents a potential selling opportunity due to the presence of a well-defined bearish channel pattern. This pattern suggests ongoing selling pressure and a higher likelihood of further declines in the coming minutes or hours.
Sell Entry: Consider entering a short position around the current price of 111.46, positioned close to the channel resistance. This offers an entry point near a potential reversal zone.
Target Levels: Initial bearish targets lie at the support levels of 111.07 and 110.82, marking previous support zones within the channel.
Stop-Loss: To manage risk, place a stop-loss order above the broken channel resistance line at 111.70. This helps limit potential losses if the trend unexpectedly reverses.
Thank You.

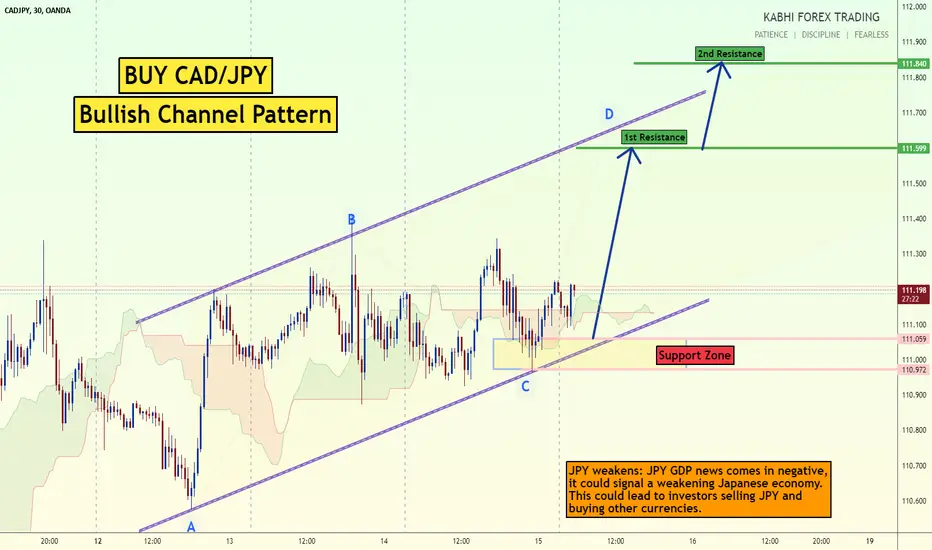
Buy CADJPY Bullish channelThe CAD/JPY pair on the M30 timeframe presents a potential buying opportunity due to a well-defined bullish channel pattern. This pattern suggests ongoing buying pressure and a higher likelihood of further advances in the coming minutes or hours.
Buy Entry: Consider entering a long position around the current price of 111.19, positioned close to the channel support. This offers an entry point near a potential continuation of the upward move.
Target Levels: Initial bullish targets lie at the resistance levels of 111.60 and 111.84, marking previous resistance zones within the channel.
Stop-Loss: To manage risk, place a stop-loss order below the support line of the channel at 110.90. This helps limit potential losses if the price reverses and breaks back down.
Thank you
CADJPY - Top-Down Analysis 📹 From Daily To H1Hello TradingView Family / Fellow Traders. This is Richard, also known as theSignalyst.
📈 Here is a detailed update top-down analysis for #CADJPY.
Which scenario do you think is more likely to happen? and Why?
📚 Always follow your trading plan regarding entry, risk management, and trade management.
Good Luck!.
All Strategies Are Good; If Managed Properly!
~Rich


CADJPY Confirmed buy signalThe CADJPY pair has been trading within a Fibonacci Channel Up since the March 2020 market bottom. The recent rejection on the 1.5 Fibonacci level back to the 0.5 show it test and hold an important Support, the 1W MA50 (blue trend-line), which has only broken once in 3 years (since November 2020) and that was during last year's inflation crisis.
As long as it holds, it is a strong buy opportunity and evidence for that is the 1W RSI which has printed the same pattern (Channel Down break into a rebound) as the September 26 2022 and August 16 2021 lows. Both initiated rebounds that hit their prior Resistance levels.
As a result, we are taking this opportunity to buy and target the previous Resistance (from the September 25 High) at 111.000.
-------------------------------------------------------------------------------
** Please LIKE 👍, FOLLOW ✅, SHARE 🙌 and COMMENT ✍ if you enjoy this idea! Also share your ideas and charts in the comments section below! This is best way to keep it relevant, support us, keep the content here free and allow the idea to reach as many people as possible. **
-------------------------------------------------------------------------------
💸💸💸💸💸💸
👇 👇 👇 👇 👇 👇

CADJPY possible retracementAfter price broke structure to the downside with momentum, it formed liquidity at the bottom. It then retraced and formed liquidity at the top as well, just below an established supply that aligns with our golden zone. Price has just taken the top liquidity and mitigated our supply zone. It could now potentially begin to drop to take out the liquidity at the bottom as well

CADJPY Bullish as long as the 1D MA50 holds.The CADJPY pair is on a 1D MA50 (red trend-line) bounce, at the high ranges of the Fibonacci Channel Up that started on the March 2020 COVID crash bottom. The 1W RSI shows a Channel Down fractal on its second Lower Low rebound and the previous two such sequences delivered at least one more rally.
As a result, we see a strong short term buy opportunity to target the 1.5 Fibonacci extension at 112.000.
-------------------------------------------------------------------------------
** Please LIKE 👍, FOLLOW ✅, SHARE 🙌 and COMMENT ✍ if you enjoy this idea! Also share your ideas and charts in the comments section below! This is best way to keep it relevant, support us, keep the content here free and allow the idea to reach as many people as possible. **
-------------------------------------------------------------------------------
💸💸💸💸💸💸
👇 👇 👇 👇 👇 👇

CADJPY Bullish Cross signalling a buy.CADJPY it at the top of a short term Falling Wedge pattern inside a larger Channel Up.
The 1day MACD just formed a Bullish Cross. Every time the price has been on the 1day MA50 while the MACD formed a Bullish Cross, the pair traded inside a similar Falling Wedge pattern.
A break out followed with the price hitting at least the previous High (Resistance A).
Buy now and target 111.245 (Resistance A).
Follow us, like the idea and leave a comment below!!

CADJPY SELL | Day Trading Analysis Hello Traders, here is the full analysis.
Watch strong action at the current levels for SELL. GOOD LUCK! Great SELL opportunity CADJPY
I still did my best and this is the most likely count for me at the moment.
Support the idea with like and follow my profile TO SEE MORE.
Traders, if you liked this idea or if you have your own opinion about it, write in the comments. I will be glad 🤝
Patience is the If You Have Any Question, Feel Free To Ask 🤗
Just follow chart with idea and analysis and when you are ready come in THE GROVE | VIP GROUP, earn more and safe, wait for the signal at the right moment and make money with us💰

CADJPY: Short scalp next weekThinking we're starting to see JPY strength, this is because it can't stay so weak for so long imho.
Weak currency suits Japan as an exporter, to a point, but massively affects it's buying power, I do feel like we're approaching the end of this cycle of Yen weakness, by the end of this year.
I think this pair broke the rising trendline but has struggled to get back in on multiple retracement attempts, so I think we'll drop to catch the order block in the next week based on current PA.

CADJPY! Trend-line worked!Hello traders,
The diagonal line worked and we can make profits from any reversal!
Don't forget about money management.

Buy CADJPY Bullish FlagBuy CADJPY Bullish Flag
Bullish flag formation CDA/JPY -m15 Chart..
its good chance to buy today.. intraday Signals
Thank you

CADJPY Potential UpsidesHey Traders, in today's trading session we are monitoring CADJPY for a buying opportunity around 107.600 zone, CADJPY is trading in an uptrend and currently is in a correction phase in which it is approaching the trend at 107.600 support and resistance area.
Trade safe, Joe.

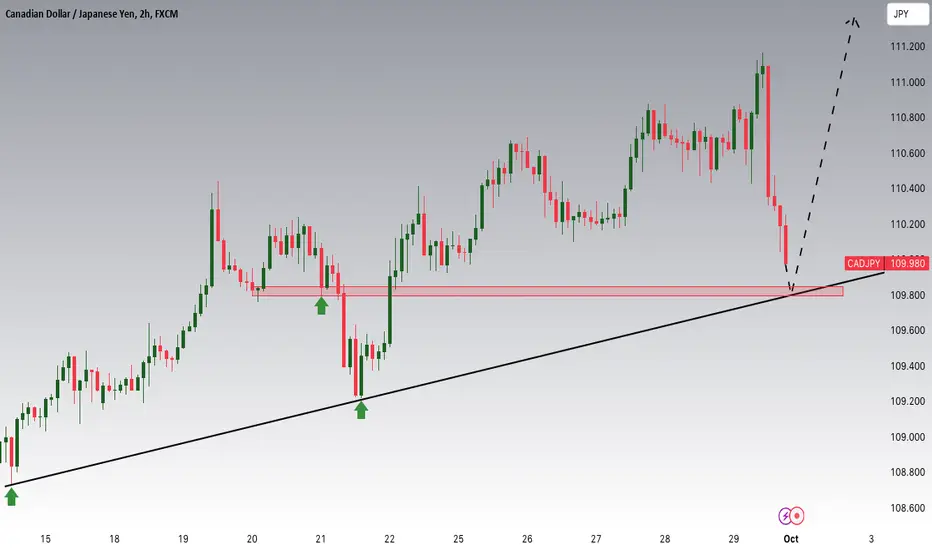
CADJPY Potential UpsidesHey Traders, in the coming week we are monitoring CADJPY for a buying opportunity around 109.800 zone, CADJPY is trading in an uptrend and currently is in a correction phase on which it is approaching the trend at 109.800 support and resistance area.
Trade safe, Joe.
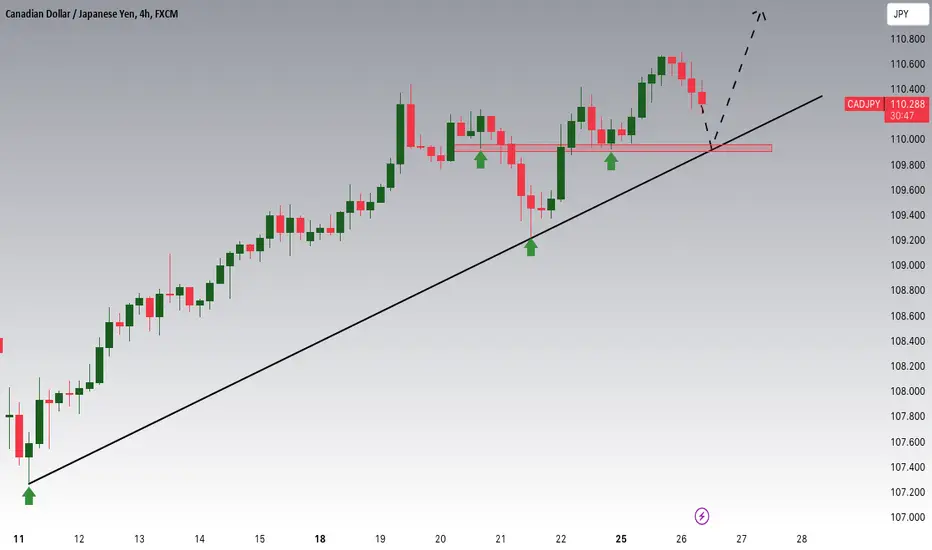
CADJPY Potential UpsidesHey Traders, in today's trading session we are monitoring CADJPY for a buying opportunity around 109.900 zone, CADJPY is trading in an uptrend and currently is in a correction phase in which it is approaching the trend at 109.900 support and resistance area.
Trade safe, Joe.
CADJPY Testing the 1-year Resistance. Will it break?The CADJPY pair has been just below the 110.615 Resistance (September 13 2022 High) for the past 3 trading sessions. The long-term pattern is a Channel Up so the trend remains bullish until it breaks downwards. The 1D MA50 (blue trend-line) is firmly supporting.
The current bullish wave doesn't differ much from the one that started on the March 24 Higher Low and peaked on the 4.0 Fibonacci extension. As a result we remain bullish on this pair and expect 113.500 (target) by the end of October.
-------------------------------------------------------------------------------
** Please LIKE 👍, FOLLOW ✅, SHARE 🙌 and COMMENT ✍ if you enjoy this idea! Also share your ideas and charts in the comments section below! **
-------------------------------------------------------------------------------
💸💸💸💸💸💸
👇 👇 👇 👇 👇 👇

Sell CADJPY Channel BreakoutSell CADJPY Channel Breakout
Price breaks the Channel Pattern now, its good chance to sell Now,
Thank you

CADJPY - Watch For This Reversal! CADJPY is on our radar at the moment. We currently appear to be in an ABC corrective wave and looking for wave C lower.
On the lower timeframe we'll be looking for reversal patterns to indicate that wave B has completed and that we've started wave C.
Trade Idea:
- Watch for lower timeframe reversal patterns or trendline breaks
- enter with stops above the aforementioned reversal pattern/trrendline break
- Targets: 107 (300pips), 104.3 (550pips)
Goodluck and as always, trade safe!
