CADJPY: Important Bearish Breakout
CADJPY broke and closed below a key daily structure support.
The broken structure turned into a resistance now.
I expect a bearish continuation to 103.0 / 101.8 levels.
❤️If you have any questions, please, ask me in the comment section.
Please, support my work with like, thank you!❤️
Cad-jpy

CAD JPY - FUNDAMENTAL DRIVERSCAD
FUNDAMENTAL OUTLOOK: WEAK BEARISH
BASELINE
Even though most recent jobs print offset all of the jobs that was lost in 2H22, the housing market still poses big risks for the Canadian economy. With a big increase in variable-rate mortgages after the pandemic, lots of consumers will be pressed on their disposable income after mortgages need to be reset (and that is happening while price pressures are still uncomfortably high). Furthermore, despite hawkish comments from Gov Macklem heading into the Oct meeting, the bank surprised markets with a 50bsp hike when markets were pricing in a 75bsp hike. The bank also stated there is increased risks of a recession during 1H23.
POSSIBLE BULLISH SURPRISES
Catalysts that see upside in Oil (deteriorating supply outlook, ease in demand fears, OPEC developments) could trigger bullish CAD reactions. As a risk sensitive currency, and catalyst that causes big bouts of risk on sentiment could trigger bullish reactions in the CAD. A bid surprise miss in Wednesday’s CPI should seal the deal for a 25bsp hike and should put more pressure on the CAD.
POSSIBLE BEARISH SURPRISES
Catalysts that trigger downside in oil (deteriorating demand outlook, ease in supply shortage, less supply constraints, OPEC developments) could be a negative catalyst for the CAD as well. As a risk sensitive currency, and catalyst that causes big bouts of risk offsentiment could trigger bearish reactions in the CAD. A surprise beat in CPI this week could see markets lean towards a 50bsp and support CAD (but we’ll look to fade strength).
BIGGER PICTURE
The bigger picture outlook for the CAD has shifted to bearish. Given the clear risks to the growth outlook (recent negative econ data, high inflation, stress in the housing market, exposure to a slowing US economy) we think the bias is titled lower for the currency from here. Also, with the currency still relatively close to cycle peaks, and with the BoC close to terminal rate expectations, our preferred way of trading the CAD is lower on clear short-term negative catalysts.
JPY
FUNDAMENTAL OUTLOOK: BEARISH
BASELINE
In recent weeks, yield differentials of course have been the biggest driver for the JPY with the BoJ keeping 10-year JGB yields capped at 0.25% with yield curve control while other central banks are hiking rates aggressively. However, Japan has intervened in the FX market twice buying JPY and selling USDs. The intervention saw short-term downside in XXXJPY pairs, but as the fundamental remains bearish it’ll take constant intervention to stop the JPY from falling. In the week ahead, focus will remain on any big moves in US yields (especially with further incoming US data).
POSSIBLE BULLISH SURPRISES
Catalysts that push US10Y lower (less hawkish Fed, lower UC CPI, lower growth) could trigger bullish reactions from the JPY. Any catalyst that triggers meaningful downside in key commodities like Oil (deteriorating demand outlook, ease in supply shortage) could trigger bullish JPY reactions. Any additional intervention from the BoJ or MoF.
POSSIBLE BEARISH SURPRISES
Any catalysts that push US10Y higher (more aggressive Fed, higher US CPI, better growth) could pressure the JPY. Catalyst that triggers meaningful upside in Oil (improving demand, decreased supply) could trigger JPY downside. Reluctance from BoJ and MoF for intervening around the 145 level in USDJPY could spark speculative buying.
BIGGER PICTURE
The fundamental outlook remains bearish for the JPY due to yield differentials and the impact of a weaker JPY on the current account balance. As long as US10Y remain elevated and the BoJ stays stubbornly dovish and no currency intervention occurs, the bias remains lower. But take note of positioning which means we don’t want to chase the JPY lower, especially with the risk of further currency intervention should the JPY continue to weaken. The best opportunities for now remain short-term focused on further intervention or strong moves lower in US yields.

USD & CAD not recoveringUSD & CAD not recovering from CPI reports, USOIL rising which will hit JPY as a Oil net export economy. Heading for mid November it's time of the year to short USD. Also because of FED's steady interest rate increments.

CADJPY Accumulation before pump?The CADJPY pair continues to follow our trading plan presented on September 20, as it repeats the fractal of late 2021 - early 2022:
As you see, the MACD Bearish Cross was the correct sell signal we needed and the price hit the 0.618 Fibonacci target and rebounded. Right now it appears that the price has entered a consolidation phase similar to the post January 20 MACD Bearish Cross. As long as the Green Support Zone holds, we should expect within a 5 week horizon a break above the September High, targeting the 2.0 Fibonacci extension.
A break below the Zone though, shouldn't stop on the 1D MA200 (orange trend-line) but instead target the 1W MA50 (red trend-line) for the first time since December 20 2021. An additional bullish confirmation would be a break of the RSI above its own Lower Highs trend-line, which in more than a year has delivered very strong and rapid rallies.
-------------------------------------------------------------------------------
** Please LIKE 👍, SUBSCRIBE ✅, SHARE 🙌 and COMMENT ✍ if you enjoy this idea! Also share your ideas and charts in the comments section below! This is best way to keep it relevant, support me, keep the content here free and allow the idea to reach as many people as possible. **
-------------------------------------------------------------------------------
You may also TELL ME 🙋♀️🙋♂️ in the comments section which symbol you want me to analyze next and on which time-frame. The one with the most posts will be published tomorrow! 👏🎁
-------------------------------------------------------------------------------
👇 👇 👇 👇 👇 👇
💸💸💸💸💸💸
👇 👇 👇 👇 👇 👇

Canadian Dollar / Japanese YenHello traders Good Day Ahead !
Here is my analysis about Canadian Dollar / Japanese Yen
Price is forming in V-angle and moving around at 108.600-700
major resistance level of this pair is at 110.700-800
Support level for this pair is 107.600-700 which is out 1st Target
wait for the breakout for next move for bearish or remain Bullish
Good Luck

CADJPYPrice held daily support zone
Price reacted very bullish off of daily support zone
Looking for entry at restest and ride to previous hights


InvestMate|CAD/JPY Will we go higher or is this already a peak?CAD/JPY Will we go higher or is this already a peak?
🍁Unemployment remaining low at 5.2%.
🍁Inflation slowly slowing The latest reading on 19 October indicated 6.9% which, compared to the peak of 8.1% recorded in June, offers a breath of optimism.
🍁Interest rates definitely higher than in the EU. At 3.25%. With the next rate hike due on 10 October, the market assumes it will be a 75 basis point hike to 4%.
🍁Trade balance at a high of C$1.52B in August. On 3 November we will find out how much it amounted to in September. Canada is now seeing very strong trade volumes. The highest in a decade.
🍁Manufacturing PMI low of 49.80 points.
tradingeconomics.com
🍁The Consumer Confidence Index is falling but neither all-time highs nor a "crisis" state is just low at 48.51 points.
tradingeconomics.com
🍁Will we see this reflected in the chart of these currencies?
🍁💴On the other side of the globe.
💴In Japan, no change.
💴Unemployment Rate low at 2.5%
💴Inflation low 3%. Japan is one of those countries that has not been hit by Inflation as much as Europe and the USA.
💴Interest rates at -0.1%. Still negative from 2016. Hence these falls in the Yen. When other countries raise rates causing their currencies to strengthen, their strength against the Yen increase.
💴For now, there are no increases on the horizon. The Bank of Japan says it has no intention of changing its monetary policy.
💴But the government doesn't want the Japanese Yen so cheap either, hence in recent days we have seen sharp falls which were interventions to stop the Yen weakening sharply against other currencies.
💴I don't think this will stop investors from pushing prices up again.
💴 Looking at the sytcajci of both currencies, I don't think anything has changed in the current trend over the months. The only threat could be unexpected monetary interventions to strengthen the Yen
📈Meanwhile on the chart.
📈On 21 October we made a double top and then after the intervention we went down into the support zone and there was a sharp overbought period.
📈Turning to the monthly chart, the first thing that catches our eye is a harmonic formation called gartley.
📈If the harmonic formation were to be fulfilled we can expect a rise to the range of the largest downward wave at the 0.786 level.
📈Assuming a stop below the post-intervention lows and a take profit at 0.786, this gives us a profit/risk range of 2.52.
🚀If you appreciate my work and effort put into this post I encourage you to leave a like and give a follow on my profile.🚀

Buy for CADJPYAs the is preparing to take another try.
The pullback is done and the daily trend is launching again.

CADJPY - Top In Place? 🤔CADJPY appears to have completed the bullish wave and now we could be at the start of the bearish wave.
We're currently looking to catch the bearish wave once we see confirmation. The confirmation we're looking for is rejection of fib and then break of the red trendline to indicate the next impulse has started.
Trade idea:
- Watch for rejection of fib levels
- risk entry on rejection of fib
- Safe entry on break of red trendline
- stoploss above correction once red trendline breaks
- Targets: 101.6 (670pips), 96 (1150pips)
See below for the weekly timeframe
Goodluck and as always, trade safe!

Cadjpy idea for Swing trading(long)Composite Indicator
TrendSpotter Sell
200 Day Moving Average Buy
100 - 200 Day MACD Oscillator Buy
100 - Day Average Volume: 244,563 Average: 50% Buy

CAD/JPY - PAPA Strategy Long time no see ... I have been busy. Hope you are all well as well.
Pure Advanced Price Action -
Keep It Super Simple (KISS it)
Happy Trading. x

CADJPY: Very Bullish Setup 🇨🇦🇯🇵
Hey traders,
After a 2 weeks-long consolidation on a key horizontal support,
CADJPY leaves very bullish clues.
Forming a double bottom formation, the price closed above its neckline.
I believe that the pair will keep growing at least to 108.0.
❤️If you have any questions, please, ask me in the comment section.
Please, support my work with like, thank you!❤️

CADJPYLooks like price may be exhausting and may setting a resistance level here at some point before testing the previous lows. I would love to see 38% retracement or greater on the 1 hour. The 1 hour and monthly seem to match regarding the mac d. Price has been gaining strength recently with volume declining on the 1 hour. Let's see how this plays out. On the previous months candle, we have a wick possibly closing on above average volume with the newest month opening below the previous candles open. I know JPY is pumping money into the economy. I don't know how much longer that will last.

⭕the best buying and selling areas for the CAD/JPY🧨🔥🔰You can see the analysis of the Canadian dollar to Japanese yen currency pair in the four-hour time frame (CADJPY_ 4H)🔍💣
💥As it is clear from the picture, the price is moving in an Bullish parallel channel🖤❗If the price can break the lower line of the channel (dynamic support) and stabilize❗ below it, then it can have a downward trend until the DEMAND zone and Support🧡 🔻
If the price can break the Downward trend line🖤 and stabilize❗ above it, it can experience an increase up to the Resistance🧡, and if it breaks the upward Resistance🧡 and stabilizes❗ above it, it can have another increase up to the SUPPLY zone🔺🚀
which direction will the price go to the GREEN💚 side or the RED❤️ side❓❓
I hope the analysis was useful for you🤍🌹
📌Please introduce the channel to your friends 🙏🏻
_________📈TRADER STREET📉__________

CADJPY Short PossiblyCADJPY seems to forming a bullish pennant .. momentum is picking up with full bearish candles… waiting for continuation for the official move.

CADJPY Sell-opportunity on a long-term rising trend.The CADJPY pair has been on a (very) long-term rising trend as depicted by the Fibonacci Channel on this chart, since the March 2020 market low. At the moment we see a short-term pull-back after the price made a new Higher High since the April 21 one.
Based both on the RSI and MACD indicators, it appears that we are in a similar pull-back leg as the one that started on October 21 2021. As you see the MACD was on a Bearish Cross with the RSI dropping after previously breaking a Lower Highs trend-line.
That sequence found bottom on the 0.618 Fibonacci retracement level. On the current pattern that level is at 104.810 and that is our target on the short-term. This is invalidated if we break above the 110.630 Resistance, in which case we will take it as a buy break-out signal, targeting the 2.0 Fibonacci extension of the Channel. Further selling can be made if the price breaks below the 1.0 Channel Fib, in which case we would expect it to reach the 1D MA200/ 1W MA50 (orange and red trend-lines respectively) Support Zone.
--------------------------------------------------------------------------------------------------------
** Please support this idea with your likes and comments, it is the best way to keep it relevant and support me. **
--------------------------------------------------------------------------------------------------------

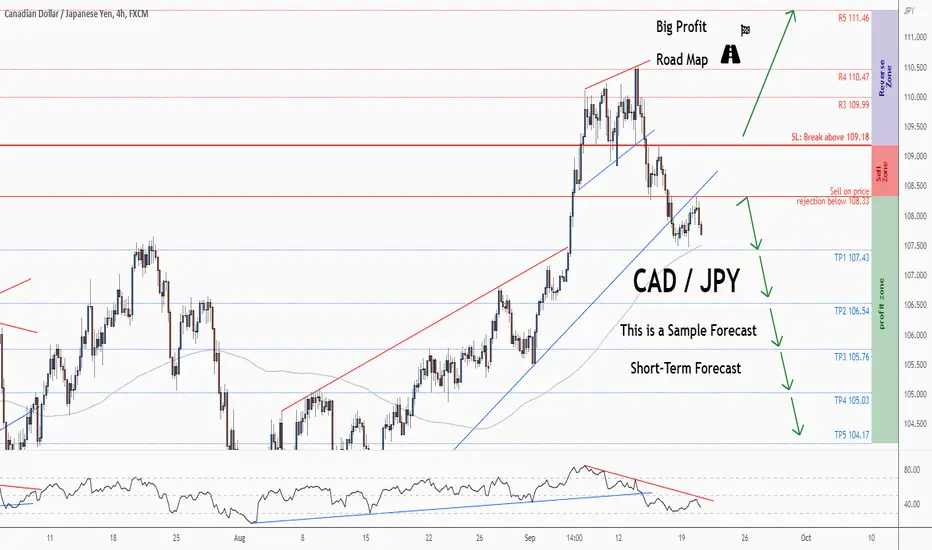
💡Don't miss the great sell opportunity in CADJPYTrading suggestion:
". There is still a possibility of temporary retracement to the suggested resistance line (108.33).
if so, traders can set orders based on Price Action and expect to reach short-term targets."
Technical analysis:
. CADJPY is in a range bound, and the beginning of a downtrend is expected.
. The price is above the 21-Day WEMA, which acts as a dynamic support.
. The RSI is at 36.
Take Profits:
TP1= @ 107.43
TP2= @ 106.54
TP3= @ 105.76
TP4= @ 105.03
TP5= @ 104.17
SL: Break Above R2
❤️ If you find this helpful and want more FREE forecasts in TradingView
. . . . . Please show your support back,
. . . . . . . . Hit the 👍 LIKE button,
. . . . . . . . . . . Drop some feedback below in the comment!
❤️ Your Support is very much 🙏 appreciated!❤️
💎 Want us to help you become a better Forex / Crypto trader?
Now, It's your turn!
Be sure to leave a comment; let us know how you see this opportunity and forecast.
Trade well, ❤️
ForecastCity English Support Team ❤️
💡Don't miss the great sell opportunity in CADJPYTrading suggestion:
". There is still a possibility of temporary retracement to the suggested resistance line (108.33).
if so, traders can set orders based on Price Action and expect to reach short-term targets."
Technical analysis:
. CADJPY is in a range bound, and the beginning of a downtrend is expected.
. The price is above the 21-Day WEMA, which acts as a dynamic support.
. The RSI is at 36.
Take Profits:
TP1= @ 107.43
TP2= @ 106.54
TP3= @ 105.76
TP4= @ 105.03
TP5= @ 104.17
SL: Break Above R2
❤️ If you find this helpful and want more FREE forecasts in TradingView
. . . . . Please show your support back,
. . . . . . . . Hit the 👍 LIKE button,
. . . . . . . . . . . Drop some feedback below in the comment!
❤️ Your Support is very much 🙏 appreciated! ❤️
💎 Want us to help you become a better Forex / Crypto trader ?
Now, It's your turn !
Be sure to leave a comment; let us know how you see this opportunity and forecast.
Trade well, ❤️
ForecastCity English Support Team ❤️

CAD-JPY RETESTCAD-JPY RETEST
Support level is key, I expect a rebound around this level.
wait for a reversal pattern to form
Buy on the green supply and demand zone!


cadjpyThere is a possibility of correction in the four-hour period, although the trend is upward in higher periods.

