CADCHF dropping nicely, potential for further drop!CADCHF has broken major support-turned-resistance level at 0.7809 (Fibonacci retracement, horizontal overlap resistance) and remains below our Ichimoku cloud signalling that there is bearish momentum. Our next resistance is at 0.7830 which is above our 61.8% Fibonacci retracement and also at a swing high resistance. Price could potentially drop all the way to major support at 0.7714 (Fibonacci retracement, horizontal overlap support).
Trading CFDs on margin carries high risk.
Losses can exceed the initial investment so please ensure you fully understand the risks.
Cadchfbuy

CADCHF on major channel resistance, possible further dropCADCHF is now testing our long term channel resistance once again and a further drop could occur from this level as it has respected the channel so well so far. Our 1st resistance is at 0.7438 (Fibonacci retracement, horizontal overlap resistance) and our next support is all the way down at 0.7368 (Fibonacci extension).
Trading CFDs on margin carries high risk.
Losses can exceed the initial investment so please ensure you fully understand the risks.


CADCHF Long Position (Long Term) Based on Inverted H&S PatternThis research is for informational purposes and should not be construed as personal advice. Trading any financial market involves risk. Trading on leverage involves risk of losses greater than deposits.
Please comment below and Like if you agree with my analysis.

CADCHF Bollinger Band Spike On Strong Support LevelHi traders,
Another close spike (not the best) on the CADCHF 15M chart on an important support level. I am targeting the break of the top for my profits. Right now the trade is on break-even and lets see how it continues.
(This is not a trade recommendation!)

What say you, Swiss Franc?From the previous two trading session, the Swiss Franc descended strongly against its major Forex currencies. An acquaintance of mine has told me that although no news of it was there, it seems that the SNB (Swiss National Bank) has intervened with the Swiss.
When I started stock and forex trading, I've already heard rumors and sayings that the Swiss Franc is a 'controlled currency.'
Several Swiss Franc pairs have reached several resistance/support; after two days of intense decline on the currency, I'm expecting some pullback where it may give a better entry position to be able to enjoy the ride!


CADCHF Uptrend ContinuationCADCHF has started a new uptrend and I was waiting for the pullback to enter LONG on this trade.
Here are the things that I am looking for to enter this trade setup:
1. Price will retrace around 38.2 to 50.0 Fibonacci levels which both coincide with previous support and resistance areas.
2. Strong green candle has closed with its low touching the 38.2 Fibonacci level and above the 10 SMA (blue line).
3. BB shows strong momentum upwards as price is contained near the upper band and RSI is also showing a move upwards.
Will enter this trade at 0.73250 with initial TP of 0.74750 to achieve a 1:2 RRR while setting a 75-pip stop loss, just about the size of the strong green candle.

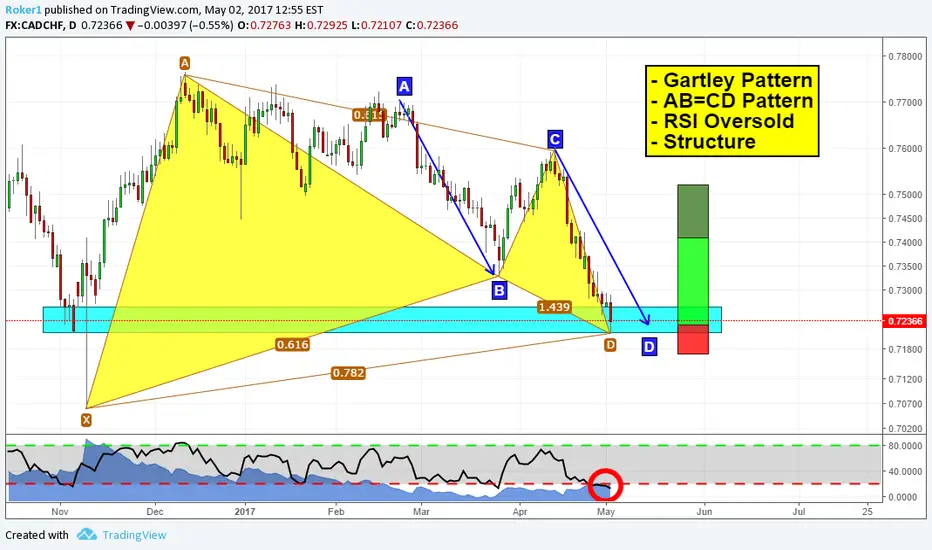
Will CADCHF go up?Hey guys,
another chart today, this time it's CADCHF's turn. As you can see the daily chart is giving us multiple reasons to look for long opportunities, and pay attention to the "look for" verb, it doesn't mean we're going to take the trade with no confirmation (since we're on the daily i don't trade patterns on the daily itself). Instad, i've outlined the structure zone that i think may push price higher and there i'm going to seek for candlestick formations in order to confirm my long bias.
This way i can reduce my stop loss size but at the same time, take into consideration the bigger targets for extended targets.
This is how powerful multiple timeframe analysis can be.
I'll keep you updated.
If you want to ask something or just share your view, post a comment below.
Otherwise, see you in the next chart!