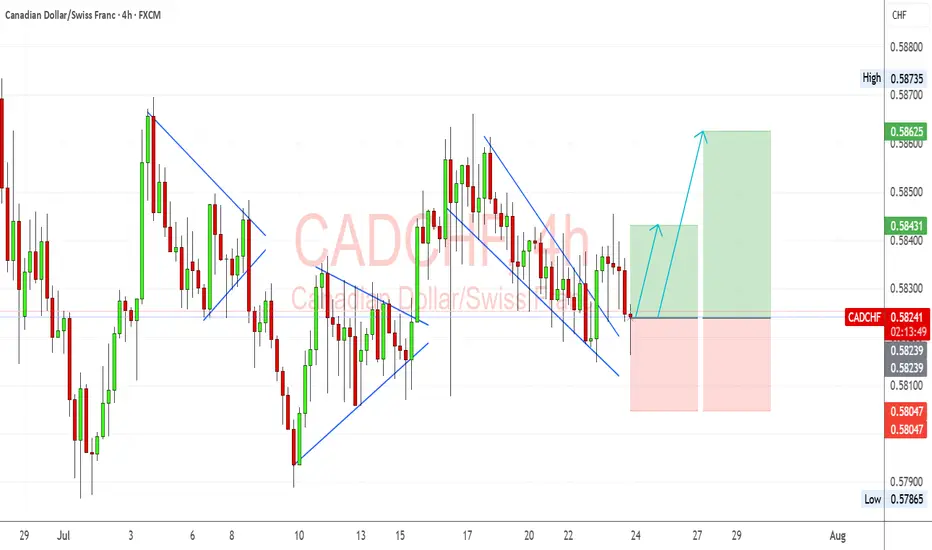
CADCHF Bullish Reversal in Motion Channel Break & Momentum ShiftCADCHF setup is developing into a potential bullish recovery after a breakout from a falling wedge. I’m looking for signs of buyer control as price attempts to build higher structure off the recent breakout.
📊 Technical View (My Setup Insight):
Falling Wedge Breakout: Price has cleanly broken out of the descending channel/wedge formation. That’s often a reversal signal, especially near support zones.
Support Holding: The pair found buyers around 0.5810–0.5820, an area tested multiple times in July. This zone has acted as a soft base.
Bullish Flag Recovery: Prior corrective patterns (flags/pennants) were followed by strong impulsive moves, and we may be repeating this pattern now.
Next Targets:
TP1: 0.5843 – aligns with previous structure and minor resistance.
TP2: 0.5862 – near the most recent high and top of consolidation.
Stop-Loss: Below 0.5800 to invalidate the reversal structure.
🧮 Fundamental Drivers (My Outlook):
CAD Support from Oil Stability: Oil prices have firmed around $78–$80, which helps the CAD via improved trade and energy revenue prospects.
SNB Stance Neutral-Dovish: Swiss inflation remains soft, and SNB has signaled comfort with its current policy rate, reducing CHF bullish pressure.
BoC Hawkish Bias: Despite softening Canadian CPI, the BoC remains cautious and hasn’t ruled out future hikes. CAD remains supported relative to CHF.
Global Risk Mood: CHF is sensitive to risk-off flows. With equities and commodities rebounding modestly, safe haven flows into CHF may slow.
⚠️ Risks to the Setup:
A sudden drop in oil prices could hurt CAD.
Risk-off sentiment due to geopolitical tensions or US equity selloffs could fuel CHF strength.
Any surprise SNB jawboning about FX could cause CHF to spike.
📆 Upcoming Events to Monitor:
Canadian GDP / Retail Sales – if strong, reinforces CAD recovery.
Swiss KOF Economic Barometer – gives insight into CHF macro tone.
Oil Inventories – strong builds or drawdowns influence CAD indirectly.
🔁 Leader/Lagger Context:
CADCHF is often a lagger, especially when risk sentiment or oil makes bigger moves. It can follow USDCHF or USDCAD behavior due to shared components.
If oil or global risk sentiment shifts, CADCHF tends to react with a small lag, making it great for secondary confirmation trades.
🧩 Summary – Bias & Watchpoints:
I currently hold a bullish bias on CADCHF following the falling wedge breakout and support defense. Fundamentals are moderately in favor of CAD due to oil stability and BoC’s cautious stance versus the more passive SNB. Key risks include any renewed CHF demand from risk-off shifts or soft Canadian economic surprises. The most critical levels now lie at 0.5843 and 0.5862 for upside targets, while 0.5800 remains key invalidation support.
Cadchfsell
CADCHF SELL/SHORTBy utilizing Fibonacci retracement levels, historical patterns, , we can formulate a hypothesis that the market might follow a similar trajectory if bearish sentiment prevails.

CAD/CHF SELL/SHORTBy utilizing Fibonacci retracement levels, historical patterns, , we can formulate a hypothesis that the market might follow a similar trajectory if bearish sentiment prevails.

CADCHF - Trade analysis !!Hello traders!
‼️ This is my perspective on CADCHF.
Technical analysis: Here we are in accumulation phase for the last couple of months. My expectation is price to manipulate buy side liquidity and maybe filling the imbalance. After that to reject from bearish OB to distribute lower.
Like, comment and subscribe to be in touch with my content!

CADCHF Bearish Breakout!HI,Traders !
CAD-CHF was trading in an
Uptrend along the rising
Support It has been broken. but now After retesting
the horizontal level at 0.63518
We will witness bearish
and we will be
Expecting a further move down !
Comment and subscribe to help us grow!

CAD/CHF Bearish Reversal Setup in Play The chart suggests a potential short setup based on the price's reaction to a resistance zone and the presence of a bearish order block. The trade appears to follow a risk-to-reward ratio strategy with a clear stop-loss and multiple take-profit levels defined below the current price.
Key Observations
1. Entry Zone: The short trade is initiated near 0.63230, around a resistance area.
2. Stop-Loss: Positioned at 0.64002, just above the recent highs, to minimize risk.
3. Take-Profit Levels:
First target: 0.62836 (close support).
Second target: 0.62458.
Final target: 0.62080, aligned with a strong demand zone.
4. Order Block: The highlighted zone indicates a bearish order block, signaling a potential reversal from the resistance level.
5. Momentum: The price is consolidating near the resistance, indicating a potential move downward, provided sellers gain control.
Strategic Implications:
Bearish Confirmation: Wait for a decisive bearish candle or rejection pattern before adding positions.
Risk Management: Maintain the stop-loss at 0.64002 to avoid overexposure to risk.
Profit Targets: Use scaling-out strategies at each take-profit level to lock in gains progressively.
This setup appears well-structured, with a high probability of success if the bearish bias plays out. However, traders should remain vigilant of false breakouts or sudden reversals.

CADCHF - Short active !!Hello traders!
‼️ This is my perspective on CADCHF.
Technical analysis: Here we are in a bearish market structure from 4H timeframe perspective, so I look for a short. I expect bearish price action after price filled the imbalance and rejected from bearish OB.
Like, comment and subscribe to be in touch with my content!

CADCHF - Short from bearish OB !!Hello traders!
‼️ This is my perspective on CADCHF.
Technical analysis: Here we are in a bearish market structure from 4H timeframe perspective, so I look for a short. After break of structure I expect price to make a retracement to fill the imbalance higher and then to reject from bearish OB.
Like, comment and subscribe to be in touch with my content!

CADCHF - Short from trendline !!Hello traders!
‼️ This is my perspective on CADCHF.
Technical analysis: Here we are in a bearish market structure from 4H timeframe perspective, so I look for a short. My point of interest is price to fill that huge imbalance and to reject from trendline.
Fundamental news: Upcoming week on Wednesday (GMT+2) we will see results of Interest Rate on CAD and on Thursday Interest Rate on CHF. News with high impact on currencies.
Like, comment and subscribe to be in touch with my content!

CADCHF - Long after filling the imbalance !!Hello traders!
‼️ This is my perspective on CADCHF.
Technical analysis: Here we are in a bullish market structure from 4H timeframe perspective, so I look for a long. I want price to continue the retracement to fill the that huge imbalance and then to reject from bullish OB.
Like, comment and subscribe to be in touch with my content!

SELL CADJPYAfter succesfully forecasting the previous intraday fall, helped by a JPY downward movement, and after a little back up, CADJPY is ready to go down towards the next KL.
Expecting a liitle bit of zigzag but globally going down for the next few hours.

CADCHF - Look for a sell !!Hello traders!
‼️ This is my perspective on CADCHF.
Technical analysis: Here we are in a bearish market structure from 4H timeframe perspective, so I look for a short. My point of interest is imbalance filled + rejection from OB.
Like, comment and subscribe to be in touch with my content!

CADCHF - Expect AMD Pattern !! Hello traders!
‼️ This is my perspective on CADCHF.
Technical analysis: Now price is in accumulation phase between 2 important levels 0.63000 and 0.62000, I expect we can see a manipulation of buy side liquidity and then distribution lower.
Like, comment and subscribe to be in touch with my content!

CAD/CHF "Loonie Swiss" Bank Bearish Robbery Plan on Short sideHola ola My Dear,
Robbers / Money Makers & Losers,
This is our master plan to Heist CAD/CHF "Loonie Swiss" Bank based on Thief Trading style Technical Analysis.. kindly please follow the plan I have mentioned in the chart focus on Short entry. Our target is Green Zone that is High risk Dangerous level, market is oversold / Consolidation / Trend Reversal / Trap at the level Bullish Robbers / Traders gain the strength. Be safe and be careful and Be rich.
Note: If you've got a lot of money you can get out right away otherwise you can join with a swing trade robbers and continue the heist plan, Use Trailing SL to protect our money.
Entry : Can be taken Anywhere, What I suggest you to Place Sell Limit Orders in 15mins Timeframe Recent / Nearest Swing High
Stop Loss : Recent Swing High using 1h timeframe
Warning : Fundamental Analysis comes against our robbery plan. our plan will be ruined smash the Stop Loss. Don't Enter the market at the news update.
Loot and escape on the target 🎯 Swing Traders Plz Book the partial sum of money and wait for next breakout of dynamic level / Order block, Once it is cleared we can continue our heist plan to next new target.
Support our Robbery plan we can easily make money & take money 💰💵 Follow, Like & Share with your friends and Lovers. Make our Robbery Team Very Strong Join Ur hands with US. Loot Everything in this market everyday make money easily with Thief Trading Style

CADCHF Short - descending channel and bearish flag patternCADCHF on the 4H chart its stuck in a descending channel & got rejected by that around 0.6250 resistance level. On the 1H chart its forming a bearish flag pattern which is telling us the downtrend is gonna keep going.
What's your take on this pair ?
my short entry is instant
all other Stop and Take profit
you can found on the chart
Good Luck!

CADCHF Bearish Breakout!CAD-CHF broke the key
Horizontal level of 0.62363
So we are locally bearish
Biased now so we will be
Expecting a further move down !

Easy +50 Pips On CAD/CHF , Did You Enter ? Here Is our first +50 Pips From this trade , if we can stay below this Res For Today and tomorrow , the price will go down hard
This Is An Educational + Analytic Content That Will Teach Why And How To Enter A Trade
Make Sure You Watch The Price Action Closely In Each Analysis As This Is A Very Important Part Of Our Method
Disclaimer : This Analysis Can Change At Anytime Without Notice And It Is Only For The Purpose Of Assisting Traders To Make Independent Investments Decisions.

Best Place To Short CAD/CHF To Get 200 Pips ! Ready For It ?The Price At Very Important Res Area That Was A Great Support For This Pair For Long Time So I Think It Will Push The Price To DOWNSIDE Very Hard In The Next Few Days If We Can Close Below It Today And Tomorrow .
This Is An Educational + Analytic Content That Will Teach Why And How To Enter A Trade
Make Sure You Watch The Price Action Closely In Each Analysis As This Is A Very Important Part Of Our Method
Disclaimer : This Analysis Can Change At Anytime Without Notice And It Is Only For The Purpose Of Assisting Traders To Make Independent Investments Decisions.

CADCHF - Bears Dominating! CADCHF made a triple top on the daily timeframe in the 0.67 zone, and then an impulsive downward move, showing that the bearish trend is still maintained.
And this week there was a nice bearish pattern (pinbar and bearish engulfing) at the Fibonacci levels, indicating that this could be the end of the corrective movement, and that it will resume its downtrend.
I will update the idea as it develops.

CADCHF - Look for a short !!Hello traders!
‼️ This is my perspective on CADCHF.
Technical analysis: Here we are in a bearish market structure from daily timeframe perspective, so I look for a short. My point of interest is if price make a retracement to fill the imbalance higher and then to reject from bearish order block + institutional mid figure 0.64500.
Like, comment and subscribe to be in touch with my content!

CAD / CHF !! trendline - SELL NOW⭐️ Smart investment, Strong finance
⭐️ Personal comments NOVA:
Trendline H1 formed - there was not much important data at the beginning of the week. DOWN trend - bears prevail
⭐️ SET UP CAD/CHF PRICE:
🔥SELL zone: 0.65550 - 0.65750 SL 0.66000
TP1: 0.65200
TP2: 0.64900
TP3: 0.64600
⭐️ Technical analysis:
Based on technical indicators EMA 34, EMA89 and support resistance areas to set up a reasonable SELL order.
⭐️ NOTE:
Note: Nova wishes traders to manage their capital well
- take the number of lots that match your capital
- Takeprofit equal to 4-6% of capital account
- Stoplose equal to 2-3% of capital account
- The winner is the one who sticks with the market the longest

CADCHF - Potential short !!Hello traders!
‼️ This is my perspective on CADCHF.
Technical analysis: Here we are in a bearish market structure from daily timeframe perspective, so I look for short position. My point of interest is if price fills the imbalance higher and then rejects from liquidity zone + FIBO 0.618 level + institutional big figure 0.66000. Great confluence of confirmations.
Like, comment and subscribe to be in touch with my content!
