CADCHF Bullish Reversal in Motion Channel Break & Momentum ShiftCADCHF setup is developing into a potential bullish recovery after a breakout from a falling wedge. I’m looking for signs of buyer control as price attempts to build higher structure off the recent breakout.
📊 Technical View (My Setup Insight):
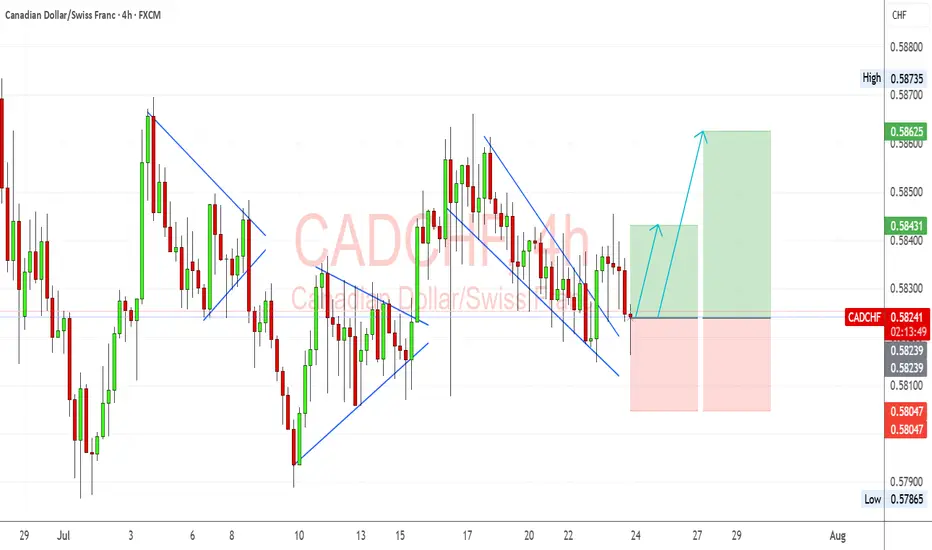
Falling Wedge Breakout: Price has cleanly broken out of the descending channel/wedge formation. That’s often a reversal signal, especially near support zones.
Support Holding: The pair found buyers around 0.5810–0.5820, an area tested multiple times in July. This zone has acted as a soft base.
Bullish Flag Recovery: Prior corrective patterns (flags/pennants) were followed by strong impulsive moves, and we may be repeating this pattern now.
Next Targets:
TP1: 0.5843 – aligns with previous structure and minor resistance.
TP2: 0.5862 – near the most recent high and top of consolidation.
Stop-Loss: Below 0.5800 to invalidate the reversal structure.
🧮 Fundamental Drivers (My Outlook):
CAD Support from Oil Stability: Oil prices have firmed around $78–$80, which helps the CAD via improved trade and energy revenue prospects.
SNB Stance Neutral-Dovish: Swiss inflation remains soft, and SNB has signaled comfort with its current policy rate, reducing CHF bullish pressure.
BoC Hawkish Bias: Despite softening Canadian CPI, the BoC remains cautious and hasn’t ruled out future hikes. CAD remains supported relative to CHF.
Global Risk Mood: CHF is sensitive to risk-off flows. With equities and commodities rebounding modestly, safe haven flows into CHF may slow.
⚠️ Risks to the Setup:
A sudden drop in oil prices could hurt CAD.
Risk-off sentiment due to geopolitical tensions or US equity selloffs could fuel CHF strength.
Any surprise SNB jawboning about FX could cause CHF to spike.
📆 Upcoming Events to Monitor:
Canadian GDP / Retail Sales – if strong, reinforces CAD recovery.
Swiss KOF Economic Barometer – gives insight into CHF macro tone.
Oil Inventories – strong builds or drawdowns influence CAD indirectly.
🔁 Leader/Lagger Context:
CADCHF is often a lagger, especially when risk sentiment or oil makes bigger moves. It can follow USDCHF or USDCAD behavior due to shared components.
If oil or global risk sentiment shifts, CADCHF tends to react with a small lag, making it great for secondary confirmation trades.
🧩 Summary – Bias & Watchpoints:
I currently hold a bullish bias on CADCHF following the falling wedge breakout and support defense. Fundamentals are moderately in favor of CAD due to oil stability and BoC’s cautious stance versus the more passive SNB. Key risks include any renewed CHF demand from risk-off shifts or soft Canadian economic surprises. The most critical levels now lie at 0.5843 and 0.5862 for upside targets, while 0.5800 remains key invalidation support.
Cadchfshort
CAD/CHF 4H Bullish Reversal Setup The pair has formed a double bottom pattern around the 0.5800 level (highlighted by the blue arrows), indicating strong support and a potential bullish reversal.
Price has broken the short-term bearish trendline and is now retracing slightly, possibly to retest the breakout zone or neckline of the double bottom.
Ichimoku Cloud is thinning, suggesting weakening bearish momentum and potential for a bullish breakout.
Key Resistance Levels:
First Target (TP1): 0.5884
Second Target (TP2): 0.5942
Current Price: 0.5852
A successful retest and bounce from the neckline area (around 0.5830–0.5840) could lead to a move toward the mentioned targets.
Conclusion:
As long as the 0.5800 support holds, CAD/CHF shows a bullish reversal potential toward 0.5884 and 0.…

CADCHF - SHORT - Statistically-backed FX shortlistCADCHF - SHORT
Daily Outlook - Statistically-backed FX shortlist
@darksheeptrades

CADCHF SellOne strong reason for this trade is that the price clearly broke down from an inverted Cup and Handle pattern and confirmed the move with a small bearish flag, making this a high-probability trend continuation short setup. These patterns together signal strong bearish momentum and give a solid reason for entering a short position.

CAD/CHF Technical Analysis – Bullish Reversal from Key Support CAD/CHF Technical Analysis – Bullish Reversal from Key Support Zone 🟢📈
📅 Date: June 1, 2025
📊 Pair: CAD/CHF
🕰️ Timeframe: Daily (D1)
📌 Key Observations:
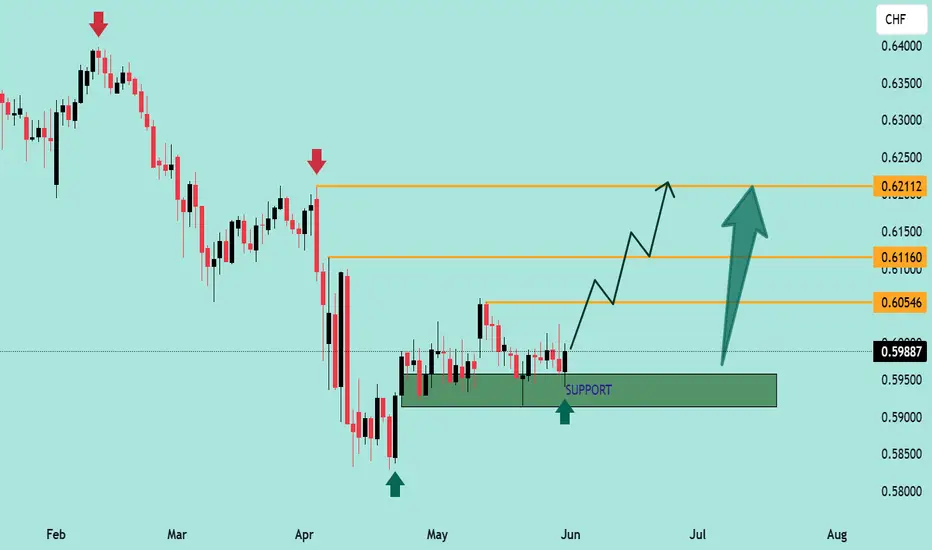
🟩 Strong Support Zone (0.5900 - 0.5950):
Price has consistently respected this demand zone since early May.
Multiple bullish rejections (green arrows) indicate strong buying interest.
📉 Previous Downtrend:
The market was in a clear bearish trend from February through April, forming lower highs and lower lows (red arrows mark swing highs).
🔁 Consolidation Phase:
Price has been ranging sideways for several weeks around the 0.5950 area, forming a base of accumulation.
📈 Bullish Scenario & Target Zones:
💥 A bullish breakout appears likely from the consolidation zone.
🚀 Upside Targets:
0.60546 – First minor resistance & potential take-profit level 🟠
0.61160 – Intermediate resistance and previous structural level 🟠
0.62112 – Major resistance and final bullish target for this swing 🟠
📈 Projection Path: The chart outlines a stair-step bullish structure with higher highs and higher lows, showing a probable path to 0.62112.
🧠 Conclusion:
CAD/CHF is showing signs of bullish reversal from a well-defined support zone. As long as price holds above 0.5950, we expect progressive upward movement toward the 0.6210 zone. Traders should monitor for bullish breakouts and potential confirmations with volume or candlestick patterns. 🔍📊
📌 Risk Management Tip:
Always use stop-loss below the support zone (~0.5900) and adjust positions as targets are reached.
CAD/CHF Short
🔻 CAD/CHF Swing Short Setup
Sell Limit Entry: 0.6040
Stop Loss: 0.6115 (above recent daily highs)
Take Profit 1: 0.5800
Take Profit 2: 0.5700
Risk-to-Reward: ~2.6:1 to TP1, ~4.5:1 to TP2
Fundamentals:
CAD is weakening from falling oil, soft economic data, and global trade risk.
CHF is gaining on risk-off sentiment and its safe-haven status.
Technical Confluence:
Monthly chart just broke below long-term support at 0.6000 for the first time ever.
Weekly chart shows price retesting 0.6000–0.6050, a perfect break-and-retest setup.
Daily shows price stalling beneath resistance without strength — no bullish breakout attempt yet.
Target Logic:
TP1 at 0.5800 is just above the panic wick zone — realistic and conservative.
TP2 at 0.5700 aligns with the extreme 2015 SNB spike low — stretch target only if momentum continues.

Pre-Market Analysis – CAD/CHF1️⃣ The price has broken below the previous support zone, which had held multiple times in the past. This area is now likely to act as a new resistance.
2️⃣ The bottom boundary of the descending channel has been touched, signaling a potential reaction or short-term bounce from this level.
3️⃣ It’s quite probable that the price retraces back to the midline of the channel before continuing its downward move. This would be a classic pullback within a bearish channel structure.
📉 If price fails to reclaim the broken support and reacts bearishly near the resistance-turned zone or the channel’s midline, it could provide a solid continuation setup to the downside.

CADCHF SHORT LIVE TRADE AND BREAKDOWN EXPLANATION 9K PROFITThe CHF/CAD pair tells the trader how many Canadian Dollar (the quote currency) are needed to purchase one Franc Swiss (the base currency). These two economies are quite intensely linked because Canada is an important producer of gold while Switzerland is a great importer of that same commodity - a quart part of the overall commodities imported by Switzerland is gold and there is a solid tradition of gold refineries/gold mining companies in the country. Switzerland can be considered as a stable and safe country. The same accounts for its currency, the Swiss Franc (CHF). The currency is often referred to as the “safe-haven” currency, as it is a backup for investors during times of geopolitical tensions or uncertainty: it is expected to increase its value against other currencies in times of volatility.

CADCHF SELL/SHORTBy utilizing Fibonacci retracement levels, historical patterns, , we can formulate a hypothesis that the market might follow a similar trajectory if bearish sentiment prevails.

+20% During The Holidays - Who Said December Was Slow? In this video I break down multiple positions on FX:CADCHF through just the first week of December 2024. I hope this acts as a reminder to never switch off, you cannot afford to. Entering the holiday season early and dropping your guard can cost you a lot of money and potential scale-ups on capital.

CADCHF – BOS and bearish continuation .. the week of 24 Feb Weekly – bearish.
Daily – bearish after a break of structure (BOS). Price below 200sma.
H4 – bearish (visible sequence of lower highs and lower lows).
Price has broken below a significant support/resistance area that has been tested multiple times. This break below also occurred with momentum as you can see from the large red candle. I expect a pullback to the zone (marked in green) and if that happens, I will be looking for signs of a bearish continuation.
If a short trade does set up, my stop would be placed above the recent swing high and an initial target at 0.62580 with the potential to go down to 0.6200.
This is not a trade recommendation, merely my own analysis. Trading carries a high level of risk, so only trade with money you can afford to lose and carefully manage your capital and risk. If you like my idea, please give a “boost” and follow me to get even more. Please comment and share your thoughts too!!
It’s not whether you are right or wrong, but how much money you make when you are right and how much you lose when you are wrong – George Soros

CADCHF - Trade analysis !!Hello traders!
‼️ This is my perspective on CADCHF.
Technical analysis: Here we are in accumulation phase for the last couple of months. My expectation is price to manipulate buy side liquidity and maybe filling the imbalance. After that to reject from bearish OB to distribute lower.
Like, comment and subscribe to be in touch with my content!

CADCHF SHORT: CAD CPI ON TAPCanada December CPI 1.8% y/y versus 1.9% expected.
Due to the above result, we are looking to sell the CADCHF due to the potential weaker Canadian dollar.

CADCHF Bearish Breakout!HI,Traders !
CAD-CHF was trading in an
Uptrend along the rising
Support It has been broken. but now After retesting
the horizontal level at 0.63518
We will witness bearish
and we will be
Expecting a further move down !
Comment and subscribe to help us grow!

CADCHF - Short Setup at Key ResistanceThe CADCHF pair just entered a notable resistance zone that has times before acted as a supply zone, leading to bearish movements. A confirmation of selling pressure, such as a bearish engulfing pattern or multiple rejection wicks at the resistance level, would increase the likelihood of a downward move.
If sellers take control at this level, the pair could move downward, with a target around the 0.63230 level.

CAD/CHF Bearish Reversal Setup in Play The chart suggests a potential short setup based on the price's reaction to a resistance zone and the presence of a bearish order block. The trade appears to follow a risk-to-reward ratio strategy with a clear stop-loss and multiple take-profit levels defined below the current price.
Key Observations
1. Entry Zone: The short trade is initiated near 0.63230, around a resistance area.
2. Stop-Loss: Positioned at 0.64002, just above the recent highs, to minimize risk.
3. Take-Profit Levels:
First target: 0.62836 (close support).
Second target: 0.62458.
Final target: 0.62080, aligned with a strong demand zone.
4. Order Block: The highlighted zone indicates a bearish order block, signaling a potential reversal from the resistance level.
5. Momentum: The price is consolidating near the resistance, indicating a potential move downward, provided sellers gain control.
Strategic Implications:
Bearish Confirmation: Wait for a decisive bearish candle or rejection pattern before adding positions.
Risk Management: Maintain the stop-loss at 0.64002 to avoid overexposure to risk.
Profit Targets: Use scaling-out strategies at each take-profit level to lock in gains progressively.
This setup appears well-structured, with a high probability of success if the bearish bias plays out. However, traders should remain vigilant of false breakouts or sudden reversals.

CADCHF - Short active !!Hello traders!
‼️ This is my perspective on CADCHF.
Technical analysis: Here we are in a bearish market structure from 4H timeframe perspective, so I look for a short. I expect bearish price action after price filled the imbalance and rejected from bearish OB.
Like, comment and subscribe to be in touch with my content!

CADCHF - Short from bearish OB !!Hello traders!
‼️ This is my perspective on CADCHF.
Technical analysis: Here we are in a bearish market structure from 4H timeframe perspective, so I look for a short. After break of structure I expect price to make a retracement to fill the imbalance higher and then to reject from bearish OB.
Like, comment and subscribe to be in touch with my content!

CADCHF - Short from trendline !!Hello traders!
‼️ This is my perspective on CADCHF.
Technical analysis: Here we are in a bearish market structure from 4H timeframe perspective, so I look for a short. My point of interest is price to fill that huge imbalance and to reject from trendline.
Fundamental news: Upcoming week on Wednesday (GMT+2) we will see results of Interest Rate on CAD and on Thursday Interest Rate on CHF. News with high impact on currencies.
Like, comment and subscribe to be in touch with my content!

Wed 27th Nov 2024 CAD/CHF Daily Forex Chart Sell SetupGood morning fellow traders. On my Daily Forex charts using the High Probability & Divergence trading methods from my books, I have identified a new trade setup this morning. As usual, you can read my notes on the chart for my thoughts on this setup. The trade being a CAD/CHF Sell. Enjoy the day all. Cheers. Jim

CADCHF - Long after filling the imbalance !!Hello traders!
‼️ This is my perspective on CADCHF.
Technical analysis: Here we are in a bullish market structure from 4H timeframe perspective, so I look for a long. I want price to continue the retracement to fill the that huge imbalance and then to reject from bullish OB.
Like, comment and subscribe to be in touch with my content!

CADCHF - Look for a sell !!Hello traders!
‼️ This is my perspective on CADCHF.
Technical analysis: Here we are in a bearish market structure from 4H timeframe perspective, so I look for a short. My point of interest is imbalance filled + rejection from OB.
Like, comment and subscribe to be in touch with my content!

CADJPY GOING DOWN !!!The CAD/JPY pair has been showing clear signs of a downtrend, with key indicators pointing towards further depreciation in the coming days. Several factors are contributing to this bearish momentum:
🔻 Weakening Canadian Dollar: Recent data suggests a slowdown in Canada's economy, putting pressure on the CAD. Lower oil prices, a crucial export for Canada, are also contributing to this weakness.
🔻 Strengthening Yen: As global uncertainties rise, the Japanese Yen is gaining strength due to its safe-haven status, putting further downward pressure on CAD/JPY.
🔻 Technical Analysis Confirms the Trend: The pair has broken key support levels, with moving averages and momentum indicators confirming that the price is heading lower. Selling pressure has been increasing as we move towards oversold territory.
Now could be a strategic time to enter a SELL position on CAD/JPY before it drops further. Stay ahead of the market and take advantage of the falling price action! 📉
