Cadchfsignal

CADCHF TO THE MOON PROBABLYCADCHF is in an upward trend, as it was in a short retesting phase and breaks its retesting phase, it is now going to touch its highs.

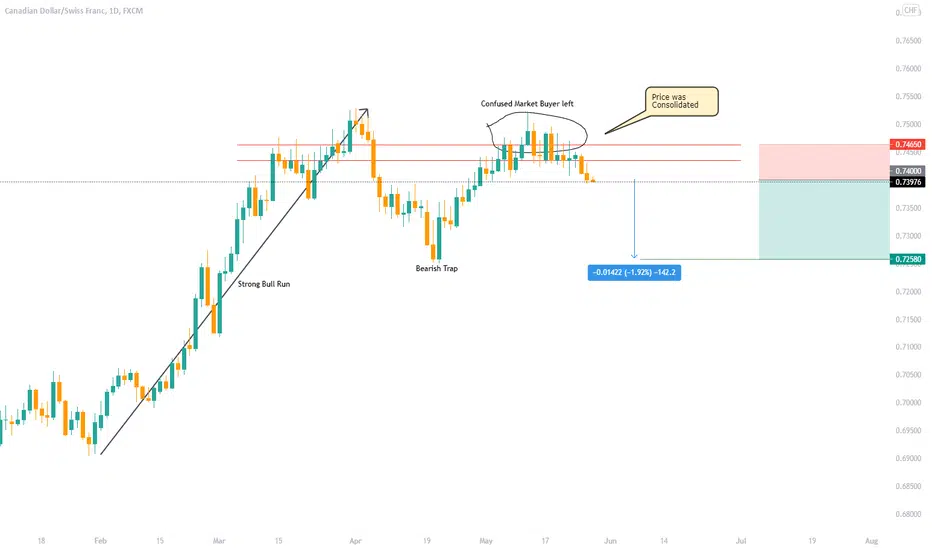
CADCHF Expecting ShortCADCHF currently breaks out its recent higher high on the D1 chart, and the market already consolidated many times and created a resistance level. I'm expecting a short for the upcoming days.

CADCHF Strong SHORT 📉What I see in this pair is quite nice and as clear as possible, as you see in the chart,
Blue area you see just above the price is strong supply which price reacted to it perfectly, you can see they pushed price lower and lower after reaching to its strong supply,
Price were moving in strong uptrend channel , which 2 weeks ago that channel were broken to down, now we reached again broken point of channel , we consider it as a strong resistance. if price break this resistance we see it higher and higher, but for now we have all confirmations for sell as long as price is bellow 0.7380 ,
we have strong support just bellow price we use them as our 1st and 2nd TP .
Any more info Comment or DM
as always more than welcome to answer your questions
1:4 R:R LOVELY 👌🏻✅
GOODLUCK Everyone!!!
FxShzd ✅📈📉✅


CADCHF: SELL NOWCADCHF time to short
Risk Reward Ratio 1:2 / 1:3
GOOD LUCK
If you have any idea, Write down on the comment.
If you agree, do not forget to like this idea

Possible Bullish Breakout on CAD/CHF Hi Traders
CAD/CHF (H4 Timeframe)
A high probability, to go LONG is forming @ 0.74762 after the market found support @ 0.74069. Only the downward break of 0.74069 would cancel this bullish scenario.
Trade details
Entry: 0.74762
Stop loss: 0.74069
Take profit 1: 0.75127
Take profit 2: 0.75780
Take profit 3: 0.76845
Score: 10
Strategy: Bullish Breakout

CADCHF - SHORT; Get ready to dump this one hard!!"Commodity Super-cycle" = Inflation = Tooth Fairy.
SHORT it hard 0.7320-0.7350
The Daily;


CAD/CHF Multi-Timeframe analysisHi Traders
CAD/CHF Multi-Timeframe analysis
H1 CHART ( BULLISH )
A very high probability, entry signal to go LONG was given at 0.71104 after the market found support at 0.70829 . Only the downward break of 0.70829 would cancel the bullish scenario.
Support & Resistances
0.70789 0.71094
0.70455 0.71331
0.70165 0.71621
H4 CHART ( BULLISH )
A very high probability, entry signal to go LONG was given at 0.71104 after the market found support at 0.70829 . Only the downward break of 0.70829 would cancel the bullish scenario.
Support & Resistances
0.70789 0.71094
0.70455 0.71331
0.70293 0.71621
DAILY CHART ( BULLISH )
A medium probability, entry signal to go LONG was given at 0.70611 after the market broke the resistance level at 0.70611 .
Support & Resistances
0.70224 0.70550
0.69035 0.71444
0.68610 0.72959
WEEKLY CHART ( BULLISH )
Waiting for a retracement lower towards the 0.70070 support level, in order to reinstate LONG positions. Next important support is the 0.68165 level.
Support & Resistances
0.70070 0.71194
0.68165 0.72008
0.67449 0.72512

Take a short position on CADCHF 4HAs you can see, price is going up in parallel channel. Price has reached to it's high level and need to get a bit rest for next movements. So I expect to see a bit decrease within the channel and almost 150 pips profit is possible.

CAD/CHF Possible Long FormingHi Traders
CAD/CHF Signal (4H Timeframe)
A medium to high probability, entry to go LONG is forming @ 0.70607 after the market found support @ 0.69993. Only the downward break of 0.69993 would cancel this bullish scenario.
Trade details:
Entry: 0.70607
Stop loss: 0.69993
Take profit 1: 0.70969
Take profit 2: 0.71583
Take profit 3: 0.72584
Score: 8
Strategy: Bullish Breakout


CADCHF Short (Sell) Trade SetupPrice is currently reacting from a zone of interest and we may get a bearish engulfing candlestick close on the open of the London session.


CADCHF: Triangle patternThe Darkest hour is that before the down, the great hope and light which always draws you towards itself. In Elliott wave analysis, these sparkling lights are the patterns, and when we encounter a pattern, we can build the whole path. What we have learned in Elliott's rules is the importance of the patterns, the most valued of these patterns are Diagonal and Triangle, which we can determine the direction of the movement according to their position.
In the case of this currency, a Triangular pattern is being formed and we know that this pattern can be formed in wave B or 4. For this reason, and considering the history of the chart, we can consider this wave as the 4th wave, which will start the uptrend in wave 5 after the downtrend.

CADCHF, Bullish Divergence, LongCADCHF has a very good signs for Bullish Movement!
+ Bullish Divergence
+Price action tells further above!

CADCHF Still in Bullish. Hello Traders,
CADCHF break out daily wedge pattern and now restest the wedge trend line.
The price created a long range move between the 0.68 and the 0.70 level.
If the market will hold the bullish momentum according to Our strategy we can win this buy trade.


