CAD_JPY STRONG UPTREND|LONG|
✅CAD_JPY is trading in an uptrend
Along the rising support line
Which makes me bullish biased
And the pair is already making
A bullish rebound from the support
So a further move up is expected
With the target of retesting the
Level above at 107.705
LONG🚀
✅Like and subscribe to never miss a new idea!✅
CADJPY

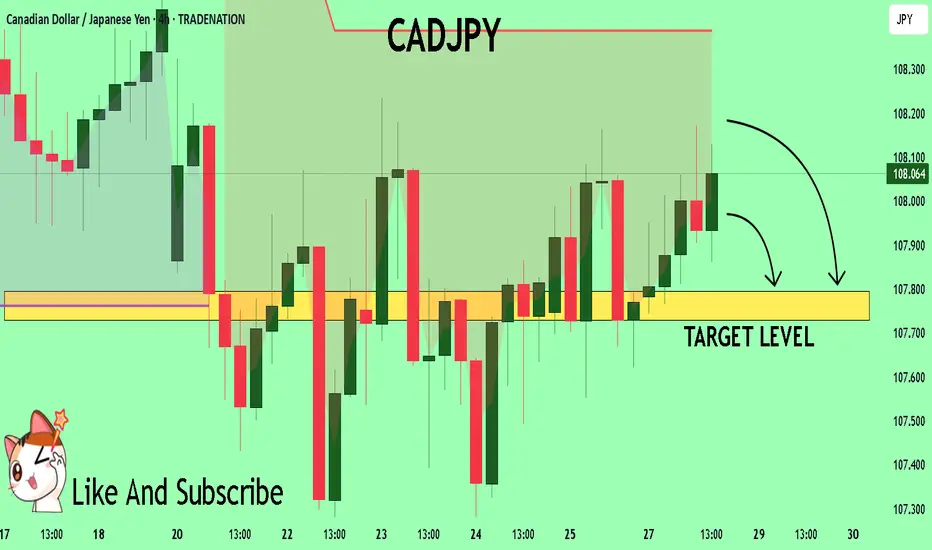
CADJPY Is Bearish! Sell!
Take a look at our analysis for CADJPY.
Time Frame: 2h
Current Trend: Bearish
Sentiment: Overbought (based on 7-period RSI)
Forecast: Bearish
The market is approaching a key horizontal level 107.345.
Considering the today's price action, probabilities will be high to see a movement to 106.396.
P.S
We determine oversold/overbought condition with RSI indicator.
When it drops below 30 - the market is considered to be oversold.
When it bounces above 70 - the market is considered to be overbought.
Disclosure: I am part of Trade Nation's Influencer program and receive a monthly fee for using their TradingView charts in my analysis.
Like and subscribe and comment my ideas if you enjoy them!

CAD/JPY BULLS ARE STRONG HERE|LONG
Hello, Friends!
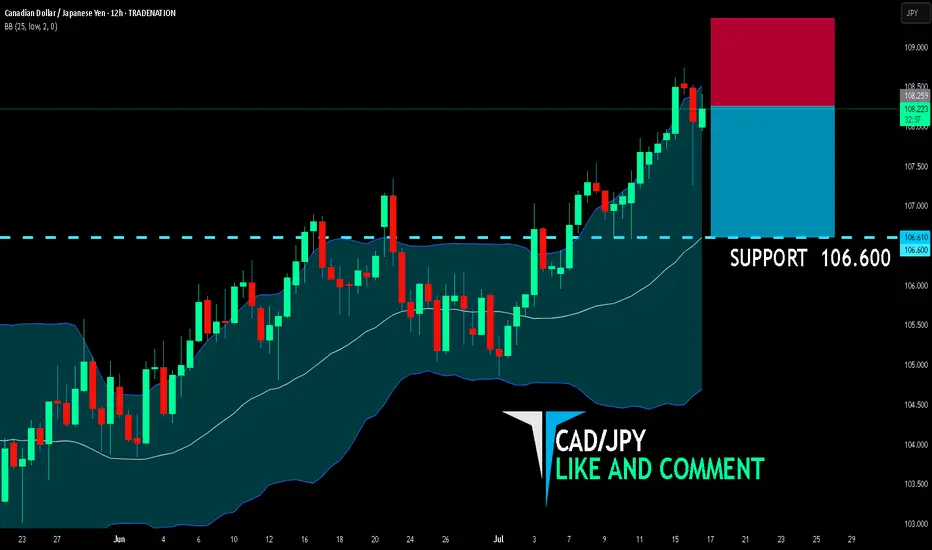
We are now examining the CAD/JPY pair and we can see that the pair is going down locally while also being in a downtrend on the 1W TF. But there is also a powerful signal from the BB lower band being nearby indicating that the pair is oversold so we can go long from the support line below and a target at 108.573 level.
Disclosure: I am part of Trade Nation's Influencer program and receive a monthly fee for using their TradingView charts in my analysis.
✅LIKE AND COMMENT MY IDEAS✅

CADJPY: Bullish Continuation is Expected! Here is Why:
Balance of buyers and sellers on the CADJPY pair, that is best felt when all the timeframes are analyzed properly is shifting in favor of the buyers, therefore is it only natural that we go long on the pair.
Disclosure: I am part of Trade Nation's Influencer program and receive a monthly fee for using their TradingView charts in my analysis.
❤️ Please, support our work with like & comment! ❤️

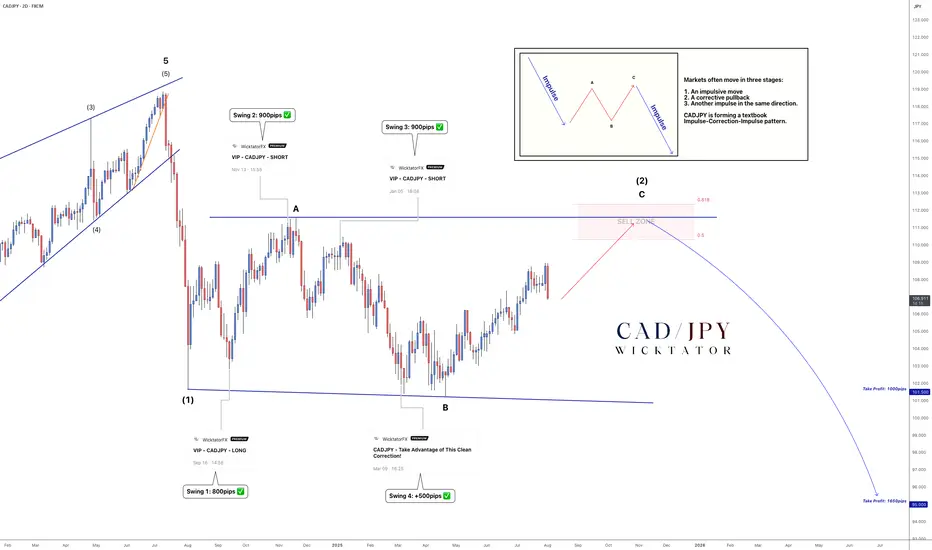
CADJPY - Wave C Near Completion: Big Drop Coming!We’ve been tracking CADJPY for years, and price has followed Elliott Wave structure almost perfectly.
In mid‑2024, an ending diagonal signalled the top and kicked off a major bearish impulse. That drop formed wave A of the current ABC correction. Wave B completed in late 2024, and price is now in wave C -pushing toward the 50–61.8 % Fibonacci retracement, which marks our sell zone.
We’ll be watching for a trendline to form into this zone. A clean break of that trendline will be our trigger to enter shorts.
Trade Idea:
- Watch for rejection in the 50–61.8 % sell zone
- Aggressive entry: Inside sell zone with stops above rejection
- Conservative entry: On break of trendline, stops above the break candle
Targets:
TP1: 101.5 (1000pips)
TP2: 95 ( 1650pips)
Optional: Leave a runner for a long-term swing
See below for our previous CADJPY setups:
Swing 1:
Swing 2:
Swing 3:
Swing 4:
Goodluck and as always, trade safe!
CADJPY Bearish Breakout!
HI,Traders !
#CADJPY made a bearish
Breakout of the key horizontal
Level around 107.376 and the
Breakout is confirmed After retesting the key
level which has now become resistance we
Will be expecting a further
Bearish move down !
Comment and subscribe to help us grow !

CAD_JPY BEARISH BREKAOUT|SHORT|
✅CAD_JPY broke the key structure level of 107.400
While trading in an local downtrend
Which makes me bearish
And I think that after the retest of the broken level is complete
A rebound and bearish continuation will follow
SHORT🔥
✅Like and subscribe to never miss a new idea!✅
Disclosure: I am part of Trade Nation's Influencer program and receive a monthly fee for using their TradingView charts in my analysis.

CADJPY Expected Growth! BUY!
My dear friends,
CADJPY looks like it will make a good move, and here are the details:
The market is trading on 107.35 pivot level.
Bias - Bullish
Technical Indicators: Supper Trend generates a clear long signal while Pivot Point HL is currently determining the overall Bullish trend of the market.
Goal - 107.90
About Used Indicators:
Pivot points are a great way to identify areas of support and resistance, but they work best when combined with other kinds of technical analysis
Disclosure: I am part of Trade Nation's Influencer program and receive a monthly fee for using their TradingView charts in my analysis.
———————————
WISH YOU ALL LUCK

CADJPY Will Keep Growing!
HI,Traders !
#CADJPY keep growing and
The pair made a bullish breakout
Of the key horizontal level
Of 108.198 and the pair is
Already retesting the new
Support and we will be
Expecting a further
Bullish move uP !
Comment and subscribe to help us grow !

CADJPY Trading Opportunity! SELL!
My dear followers,
I analysed this chart on CADJPY and concluded the following:
The market is trading on 108.08 pivot level.
Bias - Bearish
Technical Indicators: Both Super Trend & Pivot HL indicate a highly probable Bearish continuation.
Target - 107.79
About Used Indicators:
A super-trend indicator is plotted on either above or below the closing price to signal a buy or sell. The indicator changes color, based on whether or not you should be buying. If the super-trend indicator moves below the closing price, the indicator turns green, and it signals an entry point or points to buy.
Disclosure: I am part of Trade Nation's Influencer program and receive a monthly fee for using their TradingView charts in my analysis.
———————————
WISH YOU ALL LUCK
CAD_JPY WILL GO UP|LONG|
✅CAD_JPY will soon retest a key support level of 107.500
So I think that the pair will make a rebound
And go up to retest the supply level above at 108.100
LONG🚀
✅Like and subscribe to never miss a new idea!✅
Disclosure: I am part of Trade Nation's Influencer program and receive a monthly fee for using their TradingView charts in my analysis.

CAD/JPY BEARS WILL DOMINATE THE MARKET|SHORT
Hello, Friends!
CAD-JPY uptrend evident from the last 1W green candle makes short trades more risky, but the current set-up targeting 106.478 area still presents a good opportunity for us to sell the pair because the resistance line is nearby and the BB upper band is close which indicates the overbought state of the CAD/JPY pair.
Disclosure: I am part of Trade Nation's Influencer program and receive a monthly fee for using their TradingView charts in my analysis.
✅LIKE AND COMMENT MY IDEAS✅

CAD-JPY Rebound Ahead! Buy!
Hello,Traders!
CAD-JPY made a retest
Of the horizontal support
Of 107.400 from where we
Are already seeing a bullish
Rebound and we will be
Expecting a further bullish
Move up
Buy!
Comment and subscribe to help us grow!
Check out other forecasts below too!
Disclosure: I am part of Trade Nation's Influencer program and receive a monthly fee for using their TradingView charts in my analysis.

CADJPY H1 : Bearish Scenario!The 1-hour timeframe shows that after grabbing trend liquidity, the price reaches an unmitigated order block, which could drop the price from 107.84 to 107 or lower

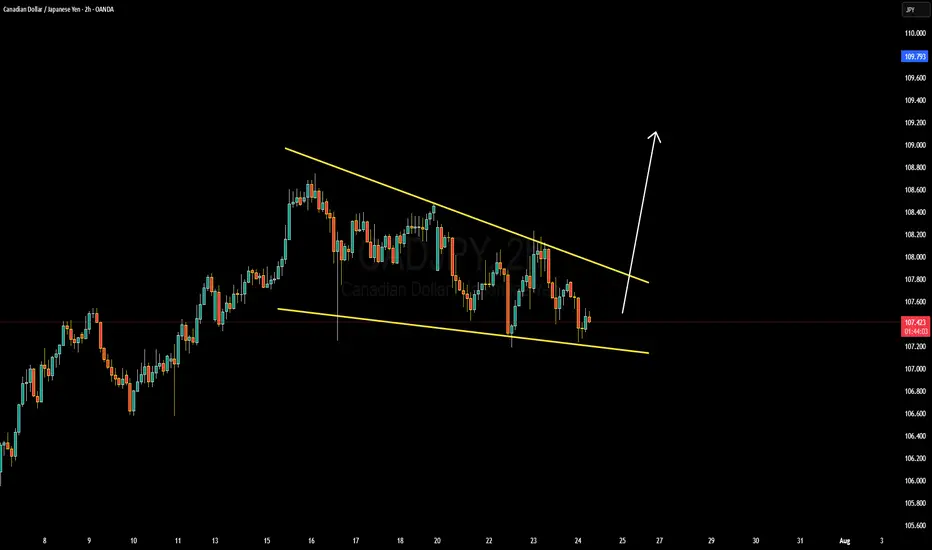
CADJPY Forming Descending ChannelCADJPY is currently trading within a clean descending channel on the 4H chart, offering a classic technical setup for a potential bullish breakout. The pair has been consolidating for several sessions within this structure, making higher lows off key support. The channel is acting as a controlled retracement in a broader uptrend, and price is now reacting from the lower boundary—indicating a strong possibility of a bullish reversal toward the upper zone near 202.70.
Fundamentally, the British pound remains supported by strong wage growth and persistent inflation, which keeps the Bank of England on alert for further rate action. Traders are pricing in the potential for policy tightening to continue or remain elevated longer than expected. In contrast, the Japanese yen stays under pressure due to the Bank of Japan’s ultra-loose stance and its reluctance to normalize interest rates, especially after the latest BOJ meeting reaffirmed dovish policy despite a weakening yen.
The technical setup aligns perfectly with the fundamental landscape. CADJPY is positioned to benefit from yield differentials and risk-on sentiment in the market. A clean breakout above the channel resistance around 199.50 could trigger a wave of bullish momentum, targeting the 202.70 zone and potentially higher if bullish fundamentals persist. The current support zone around 197.40 serves as a tight invalidation level, providing a favorable risk-to-reward for swing buyers.
With this descending channel structure and macro tailwinds favoring strength and CADJPY weakness, I'm anticipating a breakout soon. This setup is one to watch closely, as it blends technical precision with fundamental divergence—a high-probability scenario that aligns with my trading plan.
CAD-JPY Local Long! Buy!
Hello,Traders!
CAD-JPY made a retest
Of the horizontal support
Level of 107.400 and we
Are already seeing a bullish
Rebound and we will be
Expecting a further local
Bullish move up
Buy!
Comment and subscribe to help us grow!
Check out other forecasts below too!
Disclosure: I am part of Trade Nation's Influencer program and receive a monthly fee for using their TradingView charts in my analysis.

CADJPY daily 20EMA bounceSimple idea here, CADJPY is testing the daily 20EMA (overlayed on this 4H chart) and recently broke above the monthly 20EMA (overlayed)... if price reclaims the daily 10EMA (overlayer) could be a nice move up.
Very simple trade, tight SL if entering.

CAD-JPY Will Keep Growing! Buy!
Hello,Traders!
CAD-JPY keeps trading in
An uptrend and there is a
Rising support below so
We are bullish biased
And we will be expecting
A further bullish move up
Buy!
Comment and subscribe to help us grow!
Check out other forecasts below too!
Disclosure: I am part of Trade Nation's Influencer program and receive a monthly fee for using their TradingView charts in my analysis.

CAD_JPY BULLISH BIAS|LONG|
✅CAD_JPY is trading along
The rising support
And as the pair will soon retest it
I am expecting the price to go up
To retest the supply levels
Above at 108.708
LONG🚀
✅Like and subscribe to never miss a new idea!✅
Disclosure: I am part of Trade Nation's Influencer program and receive a monthly fee for using their TradingView charts in my analysis.

CAD/JPY BEARS WILL DOMINATE THE MARKET|SHORT
CAD/JPY SIGNAL
Trade Direction: short
Entry Level: 108.259
Target Level: 106.600
Stop Loss: 109.355
RISK PROFILE
Risk level: medium
Suggested risk: 1%
Timeframe: 12h
Disclosure: I am part of Trade Nation's Influencer program and receive a monthly fee for using their TradingView charts in my analysis.
✅LIKE AND COMMENT MY IDEAS✅
#CADJPY:Targeting 130.00 Almost 30,000 Pips Swing TradeThe long-term outlook for CADJPY remains extremely bullish in the coming week. My initial target is 115, followed by 120, and ultimately 130. This would result in a total of 30,000 pips of movement in the swing. Please use this analysis for educational purposes only.
Good luck and trade safely!
Like, comment, and share this idea!
Team Setupsfx_
❤️🚀

CAD-JPY Strong Bullish Breakout! Buy!
Hello,Traders!
CAD-JPY keeps trading in a
Strong uptrend and the pair
Made a strong bullish breakout
Of the key horizontal level
Of 108.299 so we are bullish
Biased and we will be expecting
A further bullish move up
Buy!
Comment and subscribe to help us grow!
Check out other forecasts below too!
Disclosure: I am part of Trade Nation's Influencer program and receive a monthly fee for using their TradingView charts in my analysis.

"Loonie-Yen Heist: CAD/JPY Bullish Blueprint in Motion"🕶️💼 “Operation Loonie-Yen: The CAD/JPY Clean Sweep Blueprint” 💼🕶️
(Scalp & Swing Strategy by the Thief Trader Guild)
🌟Hi! Hola! Ola! Bonjour! Hallo! Marhaba!🌟
Dear Money Movers & Strategic Operators, 🤑💰✈️
This blueprint is part of our 🔥Thief Trading Style🔥 operation—a fusion of technical precision and fundamental edge designed to tactically exploit the CAD/JPY (Loonie-Yen) setup.
🎯 Mission Objective:
Infiltrate the Bullish Zone & secure profits before the authorities (sellers) regroup.
📌 Entry Point:
"The vault's wide open!"
🔓Buy into momentum at any key level OR set a buy limit on recent swing lows using the 15m–30m charts. Wait for a pullback? Perfect—join the crew on the next dip.
🛑 Stop-Loss (SL):
Place it just below the 4H swing low (105.900) candle body wick.
But remember, your SL should match your risk style, position size, and trade frequency. Risk management is part of every successful heist.
🎯 Target Zone:
Aim for 108.500 – but exit smart if market behavior changes. Lock profits and vanish before the trap closes!
⚔️ Scalpers' Game Plan:
Only long-side jobs here. Got deep pockets? Dive right in. If not, team up with swing robbers and ride the trend. Use trailing SLs to secure every coin.
🧠 Fundamentals & Sentiment:
CAD/JPY strength is supported by intermarket flow, macro shifts, and trader sentiment. Check reports and correlations to stay a step ahead.
📰 Trading Alerts:
Be cautious around news releases—volatile spikes could trigger alarms. Avoid new entries during major drops and always protect active trades with trailing SLs.
💖 Support the Heist:
Hit that Boost button to power up the crew. Every push fuels another successful strategy. Thief Trading Style isn’t just a tactic—it’s a movement. 🏆💪
Stay alert. More heist blueprints coming soon.
Till then, trade smart. Loot legally. Vanish profitably. 🐱👤📈💸
