Forex Bank Job: CAD/JPY Profit Extraction Strategy🏦 "Operation Loonie Lift-Off" – CAD/JPY Forex Heist Blueprint! 💰💣
🌟Hi! Hola! Ola! Bonjour! Hallo! Marhaba!🌟
To all fellow Market Bandits & Profit Seekers, 🕶️💸💼
We’ve scoped out our next target – the CAD/JPY vault – and the blueprint is ready. This isn’t just a trade... it's a full-blown Forex infiltration mission based on undercover technical and fundamental recon 🔎📊.
🎯 The Mission Plan:
📍Entry Point – The Vault's Backdoor
💥 Strike at Pullback Zones 1 & 2
→ Use 15–30 min timeframe to ambush at recent lows or swings.
The best loot lies in waiting – buy limits only!
🛡️Stop Loss – Escape Routes
Set SL like a pro thief:
Pullback 1 ➤ 104.800
Pullback 2 ➤ 105.600
Base it on your crew’s bankroll and lot size. Always prep a clean getaway.
🏁Target – Secure the Goods
Primary loot zone: 106.000
(Or vanish before heat arrives 🚓💨)
⚔️ Scalpers’ Special Ops:
Only operate long side. Big wallets = quick hits. Small stacks? Join the swing squad and trail your SL like a shadow 🕶️🔐.
🔥Why This Hit?
CAD/JPY is in bullish mood driven by:
COT shifts 📈
Sentiment setups 🧠
Macro flow + cross-asset whispers 🔄
🚨 But remember: market conditions flip like fake IDs. Stay alert.
🧠 Final Tips from HQ:
🔕 Avoid new ops during major news drops
💣 Use trailing SLs to lock profits before the sirens go off
💖 Smash that 💥BOOST💥 to fund the next big mission
💼 From the Black Market Desks of the Thief Trading Syndicate™
This ain't your grandpa's trade plan — it's a strategic smash-and-grab with style and smarts. 📡🔐
💬 Drop a comment, hit the like, and recruit more to the crew.
📍See you in the next chart heist. Keep it stealthy, sharp, and profitable. 🤑🚀👊
CADJPY

CAD_JPY BULLISH BREAKOUT|LONG|
✅CAD_JPY broke the key
Structure level of 107.400
While trading in a strong uptrend
Which makes me bullish biased
And I think that after the retest of
The broken level is complete
A rebound and bullish continuation will follow
LONG🚀
✅Like and subscribe to never miss a new idea!✅
Disclosure: I am part of Trade Nation's Influencer program and receive a monthly fee for using their TradingView charts in my analysis.

CADJPY; Heikin Ashi Trade IdeaIn this video, I’ll be sharing my analysis of CADJPY, using FXAN's proprietary algo indicators with my unique Heikin Ashi strategy. I’ll walk you through the reasoning behind my trade setup and highlight key areas where I’m anticipating potential opportunities.
I’m always happy to receive any feedback.
Like, share and comment! ❤️
Thank you for watching my videos! 🙏

CADJPY is in the Up Trend Hello Traders
In This Chart CADJPY HOURLY Forex Forecast By FOREX PLANET
today CADJPY analysis 👆
🟢This Chart includes_ (CADJPY market update)
🟢What is The Next Opportunity on CADJPY Market
🟢how to Enter to the Valid Entry With Assurance Profit
This CHART is For Trader's that Want to Improve Their Technical Analysis Skills and Their Trading By Understanding How To Analyze The Market Using Multiple Timeframes and Understanding The Bigger Picture on the Charts

CADJPY Under Pressure! SELL!
My dear subscribers,
CADJPY looks like it will make a good move, and here are the details:
The market is trading on 107.07 pivot level.
Bias - Bearish
My Stop Loss - 107.40
Technical Indicators: Both Super Trend & Pivot HL indicate a highly probable Bearish continuation.
Target - 106.39
About Used Indicators:
The average true range (ATR) plays an important role in 'Supertrend' as the indicator uses ATR to calculate its value. The ATR indicator signals the degree of price volatility.
Disclosure: I am part of Trade Nation's Influencer program and receive a monthly fee for using their TradingView charts in my analysis.
———————————
WISH YOU ALL LUCK

CAD/JPY SHORT FROM RESISTANCE
Hello, Friends!
CAD/JPY is making a bullish rebound on the 3H TF and is nearing the resistance line above while we are generally bearish biased on the pair due to our previous 1W candle analysis, thus making a trend-following short a good option for us with the target being the 106.671 level.
Disclosure: I am part of Trade Nation's Influencer program and receive a monthly fee for using their TradingView charts in my analysis.
✅LIKE AND COMMENT MY IDEAS✅

CADJPY: Short Trading Opportunity
CADJPY
- Classic bearish formation
- Our team expects fall
SUGGESTED TRADE:
Swing Trade
Sell CADJPY
Entry Level - 106.89
Sl - 107.40
Tp - 105.90
Our Risk - 1%
Start protection of your profits from lower levels
Disclosure: I am part of Trade Nation's Influencer program and receive a monthly fee for using their TradingView charts in my analysis.
❤️ Please, support our work with like & comment! ❤️

CADJPY: Is the Trap Set?Price swept the liquidity below the previous day’s low and then broke structure to the upside. That’s often a strong sign that smart money just stepped in. I’m now watching for price to pull back and fill the imbalance it left after the break. If it respects that zone, there’s a good chance we’ll see it push higher toward the previous day’s high where more liquidity is waiting.
I’ve also added the 50 EMA on this chart as an extra layer of confluence. It helps me stay aligned with the overall market direction and avoid taking trades that fight the current trend.
It’s easy to get impatient here and jump in too soon, but discipline means waiting for the story to fully unfold. Trust your levels, trust the process, and remember that protecting your mental capital is just as important as protecting your trading account.

CADJPY Trading Opportunity! SELL!
My dear friends,
CADJPY looks like it will make a good move, and here are the details:
The market is trading on 106.86 pivot level.
Bias - Bearish
Technical Indicators: Supper Trend generates a clear short signal while Pivot Point HL is currently determining the overall Bearish trend of the market.
Goal - 106.29
Recommended Stop Loss - 107.19
About Used Indicators:
Pivot points are a great way to identify areas of support and resistance, but they work best when combined with other kinds of technical analysis
Disclosure: I am part of Trade Nation's Influencer program and receive a monthly fee for using their TradingView charts in my analysis.
———————————
WISH YOU ALL LUCK
CAD/JPYSince my ascending triangle formation has violated its characteristics it is no longer valid. I took this opportunity to revisit this pair and start again. I still believe price is operating from the Double Bottom Formation so I'm still looking for price to go up. Here we have 4 touches on our Trendline & A Expanding Flat Formation (highlighted in blue letters). I have entered a position after the 4hr close but im still looking for a retrace for a better position.

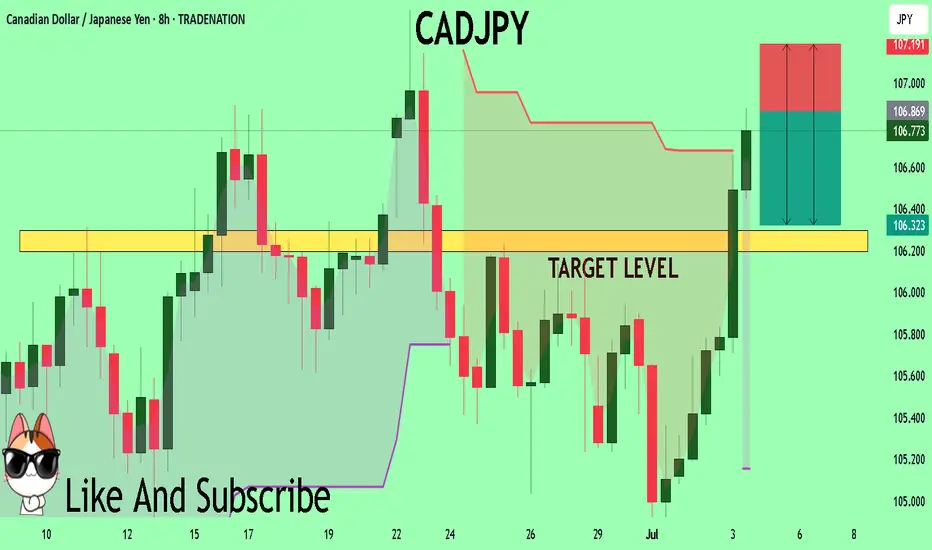
CADJPY: Bullish Continuation & Long Signal
CADJPY
- Classic bullish formation
- Our team expects pullback
SUGGESTED TRADE:
Swing Trade
Long CADJPY
Entry - 105.09
Sl - 104.65
Tp - 105.93
Our Risk - 1%
Start protection of your profits from lower levels
Disclosure: I am part of Trade Nation's Influencer program and receive a monthly fee for using their TradingView charts in my analysis.
❤️ Please, support our work with like & comment! ❤️
CADJPY Is Very Bearish! Short!
Take a look at our analysis for CADJPY.
Time Frame: 4h
Current Trend: Bearish
Sentiment: Overbought (based on 7-period RSI)
Forecast: Bearish
The market is testing a major horizontal structure 105.190.
Taking into consideration the structure & trend analysis, I believe that the market will reach 104.340 level soon.
P.S
Overbought describes a period of time where there has been a significant and consistent upward move in price over a period of time without much pullback.
Disclosure: I am part of Trade Nation's Influencer program and receive a monthly fee for using their TradingView charts in my analysis.
Like and subscribe and comment my ideas if you enjoy them!

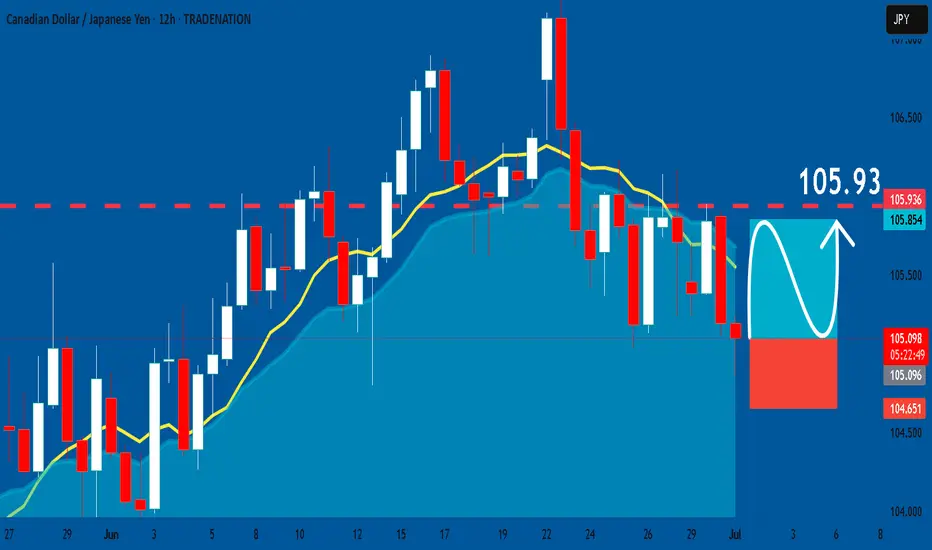
Potential bearish drop?CAD/JPY has reacted off the pivot which is a pullback resistance and could drop to the 1st support which is also a pullback support..
Pivot: 105.84
1st Support: 104.33
1st resistance: 106.80
Risk Warning:
Trading Forex and CFDs carries a high level of risk to your capital and you should only trade with money you can afford to lose. Trading Forex and CFDs may not be suitable for all investors, so please ensure that you fully understand the risks involved and seek independent advice if necessary.
Disclaimer:
The above opinions given constitute general market commentary, and do not constitute the opinion or advice of IC Markets or any form of personal or investment advice.
Any opinions, news, research, analyses, prices, other information, or links to third-party sites contained on this website are provided on an "as-is" basis, are intended only to be informative, is not an advice nor a recommendation, nor research, or a record of our trading prices, or an offer of, or solicitation for a transaction in any financial instrument and thus should not be treated as such. The information provided does not involve any specific investment objectives, financial situation and needs of any specific person who may receive it. Please be aware, that past performance is not a reliable indicator of future performance and/or results. Past Performance or Forward-looking scenarios based upon the reasonable beliefs of the third-party provider are not a guarantee of future performance. Actual results may differ materially from those anticipated in forward-looking or past performance statements. IC Markets makes no representation or warranty and assumes no liability as to the accuracy or completeness of the information provided, nor any loss arising from any investment based on a recommendation, forecast or any information supplied by any third-party.

CAD-JPY Bullish Bias! Buy!
Hello,Traders!
CAD-JPY keeps trading
In an uptrend along the
Rising support line and
We are already seeing a
Bullish rebound so we are
Bullish biased and we will
Be expecting a further
Bullish move up
Buy!
Comment and subscribe to help us grow!
Check out other forecasts below too!
Disclosure: I am part of Trade Nation's Influencer program and receive a monthly fee for using their TradingView charts in my analysis.

CADJPY BEARISH SETUP💱 CAD/JPY Reversal Watch: Bearish Pressure Builds Below Resistance
4-Hour Candlestick Chart – Analysis as of June 30, 2025
The CAD/JPY pair is showing signs of weakening momentum after repeated failures to break above the key 106.000 resistance level. This suggests growing downside pressure and increased chances of a corrective move in the near term.
🔍 Key Technical Levels
🟥 Current Price: 105.481
🚫 Resistance Zone: Around 106.000 — multiple rejections signal seller dominance
🛡️ Key Support Level: 104.000 — acting as the downside magnet
📉 Downward Arrow: Suggests bearish directional sentiment remains intact
🧠 Technical Interpretation
📌 Price action is forming a lower high, a classic sign of a potential short-term reversal.
📌 Repeated failures near the 106.000 mark highlight resistance strength and declining bullish interest.
📌 A drop below 105.000 could intensify downside momentum, with the 104.000 support as the next major level.
📌 For bulls to regain control, the pair must reclaim 106.000 with solid buying volume.

CAD/JPY Bank Heist: Bullish Breakout (or) Bearish Trap?🌟 Hi! Hola! Ola! Bonjour! Hallo! Marhaba! 🌟
Dear Money Makers & Market Robbers, 🤑💰💸✈️
Based on the 🔥Thief Trading Style🔥, here’s our master plan to loot the CAD/JPY "Loonie-Yen" Forex Bank Heist! Follow the strategy on the chart—Long Entry is the play. Our escape? Near the high-risk Danger Resistance Zone. It’s a risky level—overbought, consolidating, potential reversal—where bearish robbers lurk. 🏆💸 Take profits fast, traders! You earned it! 💪🎉
📈 Entry: The Heist Begins!
Wait for the breakout above 105.700—then strike! Bullish profits await.
Buy Stop Orders above Moving Average OR
Buy Limit Orders (15-30min timeframe) near swing lows/highs for pullback entries.
📌 Set an ALERT! Don’t miss the breakout.
🛑 Stop Loss: Protect Your Loot!
🔊 Yo, listen up! 🗣️
Buy Stop Orders? Don’t set SL until after breakout.
Place SL at nearest/swing low (4H timeframe)—adjust based on your risk & lot size.
Rebels, set SL wherever… but don’t cry later! 🔥⚡
🎯 Target: 107.300
Scalpers: Only go LONG. Use trailing SL to lock in gains.
Swing Traders: Ride the wave or join late—robbery is teamwork! 🤝
💥 Why CAD/JPY? Bullish Momentum!
Fundamentals, COT Reports, Sentiment, Intermarket Trends—checkk our bio for full analysis. 🔗🔗🔗
⚠️ Trading Alert: News = Danger!
Avoid new trades during news.
Use trailing stops to protect profits.
💖 Support the Heist! Hit the BOOST Button!
More boosts = More robberies = More profits! 💰🚀
Stay tuned—next heist coming soon! �🤗🎉

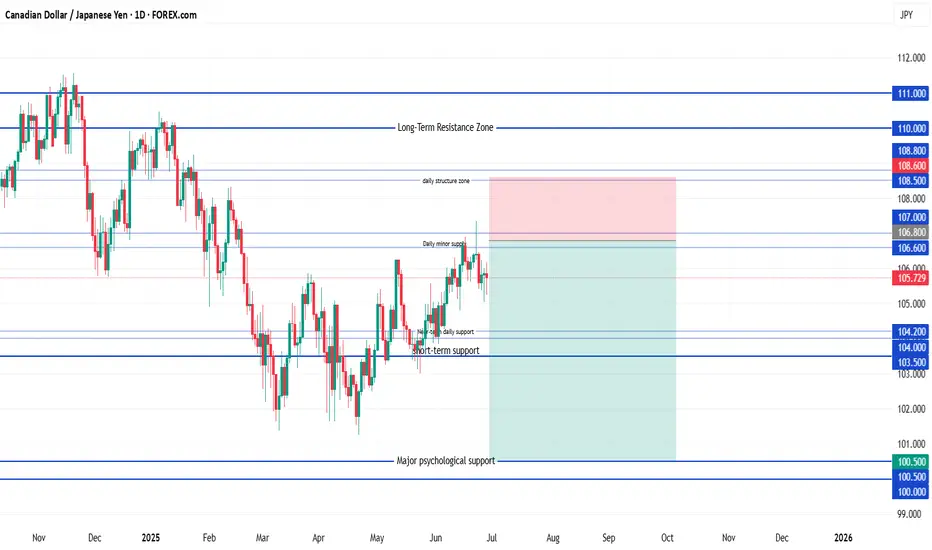
CAD/JPY ShortSell Limit Entry: 106.80
(Just under the resistance trap zone: 106.60–107.00)
Stop Loss: 108.60
Target 1: 104.20
(First minor support zone)
Target 2: 103.00
(Deeper support + recent structure base)
Target 3 (Optional hold): 100.50
(Long-term structural support zone)
CADJPY SELLBy utilizing levels, historical patterns, , we can formulate a hypothesis that the market might follow a similar trajectory if bearish sentiment prevails.

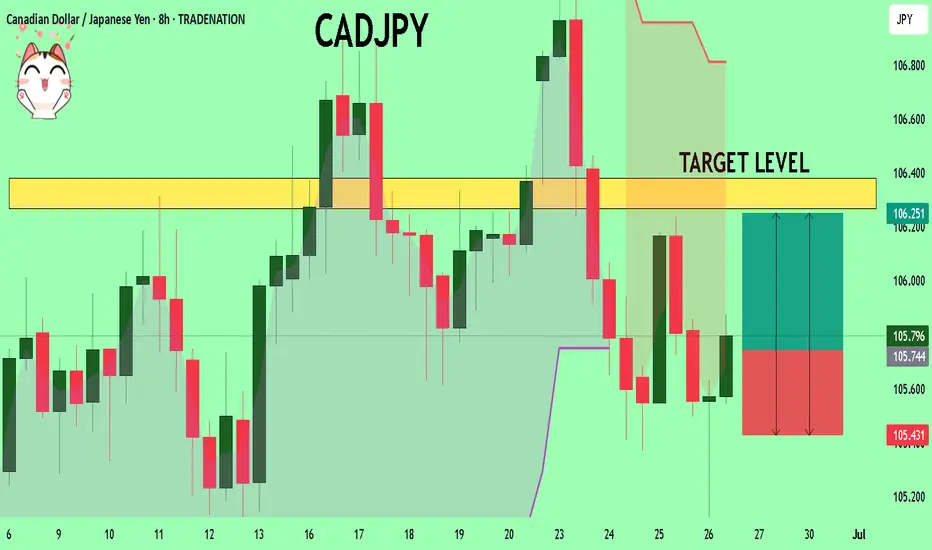
CADJPY What Next? BUY!
My dear friends,
Please, find my technical outlook for CADJPY below:
The instrument tests an important psychological level 105.74
Bias - Bullish
Technical Indicators: Supper Trend gives a precise Bullish signal, while Pivot Point HL predicts price changes and potential reversals in the market.
Target - 106.26
Recommended Stop Loss - 105.43
About Used Indicators:
Super-trend indicator is more useful in trending markets where there are clear uptrends and downtrends in price.
Disclosure: I am part of Trade Nation's Influencer program and receive a monthly fee for using their TradingView charts in my analysis.
———————————
WISH YOU ALL LUCK
CADJPY - Looking To Sell Pullbacks In The Short TermM15 - Strong bearish move.
No opposite signs.
Currently it looks like a pullback is happening.
Expecting bearish continuation until the two Fibonacci resistance zones hold.
If you enjoy this idea, don’t forget to LIKE 👍, FOLLOW ✅, SHARE 🙌, and COMMENT ✍! Drop your thoughts and charts below to keep the discussion going. Your support helps keep this content free and reach more people! 🚀
--------------------------------------------------------------------------------------------------------------------

CADJPY Bearish Breakout!
HI,Traders !
#CADJPY made a bearish
Breakout of the rising support
Which is a resistance now and
The breakout is confirmed
So we are bearish biased
And we will be expecting
A further bearish move down !
Comment and subscribe to help us grow !

CADJPY..BUY📈 On the daily timeframe, CADJPY is in a clear uptrend.
🔁 After a healthy correction, price has reached our key support level, and I’m ready to enter a long position here.
⚠️ As always, if this level breaks and the market moves against us,
I’ll open a risky short trade until we reach the next buy zone.
📉 The market does whatever it wants—nothing is guaranteed.
✅ We’re here to use smart risk management and make profit in every possible scenario.
For detailed entry points, trade management, and high-probability setups, follow the channel:
ForexCSP

CAD/JPY Holds Trendline Support with Bullish Bias IntactFenzoFx—CAD/JPY dipped from 107.34, finding support at a bullish FVG while staying above the ascending trendline.
The Stochastic Oscillator signals oversold, suggesting a potential reversal. The outlook remains bullish above 105.61, targeting a retest of 107.35. A break below 105.61 would invalidate the bullish scenario.
