CADJPY : Current Situation & Technical , Fundamental View#CADJPY
- CADJPY is currently being BUY very well due to the current MARKET SENTIMENT. So CAD automatically went up. And as expected, a JPY WEAKNESS came in the last few weeks. This was because the Bank of Japan did not continue to intervene to strengthen the JPY. Meanwhile, CAD has become very STRONG in the last few days due to the increase in OIL prices.
- Currently, the price of OIL is rising very fast. Due to this reason, CAD was BUY very fast before. You can check it by going to CAD CHARTS.
But now with JPY WEAKNESS, CADJPY is becoming a bit BUY.
- Definitely CADJPY should be slightly DOWN until 106.599 LEVEL. After that, the possibility of moving to 110.068 LEVEL is very high. The reason for that is because even now OIL PRICES are going up a bit.
Cadjpyanalysis


CADJPYNeutral on CADJPY with miscalleneous scenarios possible to happen.
Please provide your comments!!
GL!

CAD/JPY SELL Signal View....
Hello Traders, here is the full analysis for this pair,
let me know in the comment section below if you have any questions,
the entry will be taken only if all rules of the strategies will be
satisfied. I suggest you keep this pair on your watch list and see if
the rules of your strategy are satisfied.
Dear Traders,
If you like this idea, do not forget to support with a like and follow.
PLZ! LIKE COMMAND AND SUBSCRIBE.

CAD JPY Technical AnalysisThe Canadian Dollar vs. the Japanese Yen. When a trader is unsure about trading the US Dollar, the CADJPY is often determined to be a suitable replacement. However, the historically higher yield of the Canadian dollar in the past has made the CADJPY more sensitive to market wide sentiment changes than the USDJPY. Also, Canada’s large amount of energy exports, most notable oil, causes it to be affected by crude oil prices.

CadJpy- Where to sell?The long-term trend for CadJpy is up for quite some time and although I don't expect this to change soon, at this moment a deeper correction could follow.
The recent break above 108 is a false one and this can lead to a break down of the trend line support.
108 remains strong resistance and in this zone, traders should look for selling opportunities.
As a target, the horizontal 102 level can serve as a target and a break above 110 negates this scenario.

CADJPY Will Go Down!CAD-JPY was trading in along the rising support
But now we are seeing a bearish breakout
So after the retest of the horizontal resistance at 107.220
And I believe we will see bearish continuation

DeGRAM | CADJPY bullish opportunityCADJPY moving in the descending channel.
The market formed a consolidation 2 week ago and it's still moving sideways.
Price is approaching the psychological level of 105.000.
We expect retest of the support level and bullish move .
-------------------
Share your opinion in the comments and support the idea with like. Thanks for your support!

CAD/JPY Powerful SELL Signal View....
AronnoFX will not accept any liability for loss or damage as a result of
reliance on the information contained within this channel including
data, quotes, charts and buy/sell signals.
If you like this idea, do not forget to support with a like and follow.
Traders, if you like this idea or have your own opinion about it,
write in the comments. I will be glad.

CADJPY : Current Situation & Technical , Fundamental View#CADJPY
- At this point, CADJPY is selling very well due to the current MARKET SENTIMENT. So CAD automatically went down. And unexpectedly, a JPY STRONG came in the last few days. This was because the Bank of Japan intervened to strengthen the JPY. In the meantime, CAD has become very weak in the last few days because the price of OIL has gone down.
- But after that the price of OIL went down very fast. Due to this reason CAD was sold very fast before. You can check it by going to CAD CHARTS.
But now with JPY WEAKNESS, CADJPY is getting a bit SELL.
- Currently, the MARKET is slightly RISK OFF, JPY is going UP, therefore, CADJPY is being SELL.
- Definitely CADJPY should be slightly DOWN until 104.60 LEVEL. After that, the possibility of moving to 110.06 LEVEL is very high. The reason for that is because even now OIL PRICES are going up a bit.

For The Second Time CAD/JPY Running In +60 Pips 0 Drawdown !This Is An Educational + Analytic Content That Will Teach Why And How To Enter A Trade
Make Sure You Watch The Price Action Closely In Each Analysis As This Is A Very Important Part Of Our Method
Disclaimer : This Analysis Can Change At Anytime Without Notice And It Is Only For The Purpose Of Assisting Traders To Make Independent Investments Decisions.

CADJPY Eve Bottom indication long for 108.60Eve bottom formed cadjpy daily time frame. Demand zone 105.45 & 104.75 for long target 108.60. stop loss 104.50.

CAD/JPY Multi-Timeframe & Order Flow Analysis Hello Traders, here is the full analysis for this pair, let me know in the comment section below if you have any questions, the entry will be taken only if all rules of the strategies will be satisfied. I suggest you keep this pair on your watchlist and see if the rules of your strategy are satisfied. Please also refer to the Important Risk Notice linked below.

CAD/JPY Running In 60 Pips 0 Drawdown,From Last Analysis,UpdatedThis Is An Educational + Analytic Content That Will Teach Why And How To Enter A Trade
Make Sure You Watch The Price Action Closely In Each Analysis As This Is A Very Important Part Of Our Method
Disclaimer : This Analysis Can Change At Anytime Without Notice And It Is Only For The Purpose Of Assisting Traders To Make Independent Investments Decisions.

How To Trade In Sideway With Real Setup On CAD/JPY Now This Is An Educational + Analytic Content That Will Teach Why And How To Enter A Trade
Make Sure You Watch The Price Action Closely In Each Analysis As This Is A Very Important Part Of Our Method
Disclaimer : This Analysis Can Change At Anytime Without Notice And It Is Only For The Purpose Of Assisting Traders To Make Independent Investments Decisions.

CADJPY | BEARS ARE STRONGCADJPY had been trading in a bullish trend but on the 22nd Sep, it broke the range and traded below the rising trendline.
Currently, it is trading in a 10 days rectangle range where a break of downside is possible.
We are expecting at least 100 pips downside move in CADJPY whenever the range breaks.
Trade your levels accordingly.

CADJPY 4HR setupcadjpy seems to be consolidating in a rectangle and exit on either side can be a promising move

DeGRAM | CADJPY bearish opportunityCADJPY is consolidating after following a bearish move.
Price is coiling up before expansion.
If resistance level rejects price, then we can look for selling opportunities.
We expect further bearish move.
-------------------
Share your opinion in the comments and support the idea with like. Thanks for your support!

⭕the best buying and selling areas for the CAD/JPY🧨🔥🔰You can see the analysis of the Canadian dollar to Japanese yen currency pair in the four-hour time frame (CADJPY_ 4H)🔍💣
💥As it is clear from the picture, the price is moving in an Bullish parallel channel🖤❗If the price can break the lower line of the channel (dynamic support) and stabilize❗ below it, then it can have a downward trend until the DEMAND zone and Support🧡 🔻
If the price can break the Downward trend line🖤 and stabilize❗ above it, it can experience an increase up to the Resistance🧡, and if it breaks the upward Resistance🧡 and stabilizes❗ above it, it can have another increase up to the SUPPLY zone🔺🚀
which direction will the price go to the GREEN💚 side or the RED❤️ side❓❓
I hope the analysis was useful for you🤍🌹
📌Please introduce the channel to your friends 🙏🏻
_________📈TRADER STREET📉__________

CAD/JPY :: It is always on my targets .CAD/JPY :::
The previous analysis is still usable and you can choose the next targets by looking at it .
<<< GOOD LUCK >>>

CAD/JPY → 90.5 :: THE CLARITY IN THE POLARITY :: TRADEGODFOREXCOM:CADJPY
TRADE INSTRUCTIONS:
Sell any highs over the Red lines horizontally stemming from the Red circles and take profit at either Aqua coloured line. Levels are also available on the chart for use with ordered trades.
This means any new daily highs are sells accordingly.
CAD/JPY and its true value is currently in the range of 90.636 - 90.511 and 2022 in a whole saw some good impulsive moves to the upside although that bull is hibernating this Christmas as expansion and subsequently accumulation ended last week. The last leg of the expansion phase through Aug and into Sept was extremely impulsive in structure but Like the rains fall onto mountain tops and begin a legendary journey back to sea so will this asset rain on the buyers and wash away profits of those who do no perceive the unseen reality and cycles at play here.
Moral of the statement is to "go with the flow", the path of least resistance. ENJOY.

CADJPY SHORTAs we can see on daily & 4hour charts #PEPPERSTONE:CADJPY is currently price pushing lower. So we can see on the intraday 1hour chart, we can look for a sell setup.

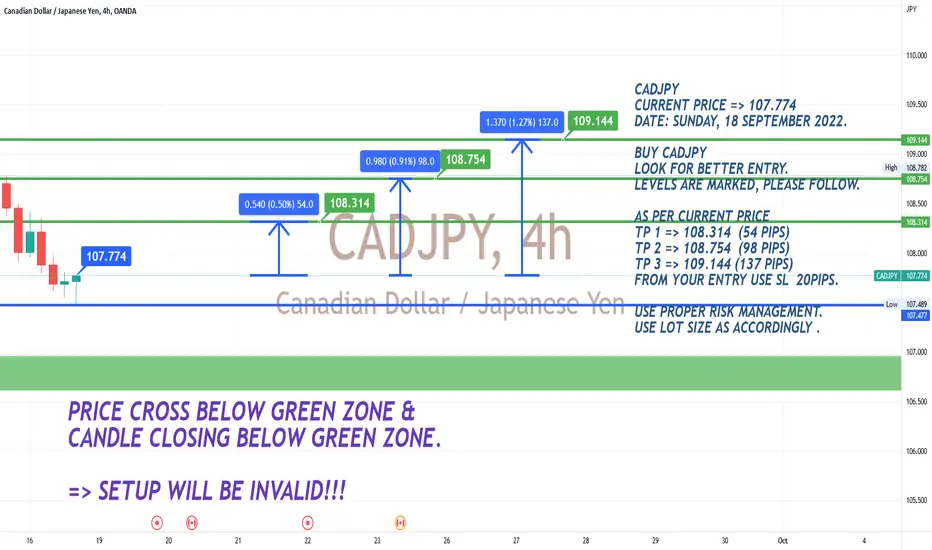
CADJPY LONG CHART ANALYSIS POSTED ON SUNDAY 18 SEPTEMBER 2022CADJPY CHART ANALYSIS !
Let's see how this pair will perform based on the analysis.
Trade safe use proper risk management always.