CADJPY POSSIBLE BUYPrice is in an uptrend and has respected the lower trendline at 0.618 Fibonacci retracement which is also a support level hence a possible buy.
The conservative ones can wait to enter after price breaks and closes out of the counter trend trendline (BLUE LINE) at H4
Cadjpylong

CADJPY : Current Situation & Technical , Fundamental View#CADJPY
- CADJPY is currently being BUY very well due to the current MARKET SENTIMENT. So CAD automatically went up. And as expected, a JPY WEAKNESS came in the last few weeks. This was because the Bank of Japan did not continue to intervene to strengthen the JPY. Meanwhile, CAD has become very STRONG in the last few days due to the increase in OIL prices.
- Currently, the price of OIL is rising very fast. Due to this reason, CAD was BUY very fast before. You can check it by going to CAD CHARTS.
But now with JPY WEAKNESS, CADJPY is becoming a bit BUY.
- Definitely CADJPY should be slightly DOWN until 106.599 LEVEL. After that, the possibility of moving to 110.068 LEVEL is very high. The reason for that is because even now OIL PRICES are going up a bit.

CAD JPY Technical AnalysisThe Canadian Dollar vs. the Japanese Yen. When a trader is unsure about trading the US Dollar, the CADJPY is often determined to be a suitable replacement. However, the historically higher yield of the Canadian dollar in the past has made the CADJPY more sensitive to market wide sentiment changes than the USDJPY. Also, Canada’s large amount of energy exports, most notable oil, causes it to be affected by crude oil prices.

CADJPY BULLISH VIEWmy view on cadjpy is bullish becuz it formed a cup and handle pattern and risk to reward is also perfact

CADJPY : Current Situation & Technical , Fundamental View#CADJPY
- At this point, CADJPY is selling very well due to the current MARKET SENTIMENT. So CAD automatically went down. And unexpectedly, a JPY STRONG came in the last few days. This was because the Bank of Japan intervened to strengthen the JPY. In the meantime, CAD has become very weak in the last few days because the price of OIL has gone down.
- But after that the price of OIL went down very fast. Due to this reason CAD was sold very fast before. You can check it by going to CAD CHARTS.
But now with JPY WEAKNESS, CADJPY is getting a bit SELL.
- Currently, the MARKET is slightly RISK OFF, JPY is going UP, therefore, CADJPY is being SELL.
- Definitely CADJPY should be slightly DOWN until 104.60 LEVEL. After that, the possibility of moving to 110.06 LEVEL is very high. The reason for that is because even now OIL PRICES are going up a bit.

CADJPYThis is how we looking at CADJPY. We wait for a breakout and candle to close above our line. how you looking at this pair?

For The Second Time CAD/JPY Running In +60 Pips 0 Drawdown !This Is An Educational + Analytic Content That Will Teach Why And How To Enter A Trade
Make Sure You Watch The Price Action Closely In Each Analysis As This Is A Very Important Part Of Our Method
Disclaimer : This Analysis Can Change At Anytime Without Notice And It Is Only For The Purpose Of Assisting Traders To Make Independent Investments Decisions.

CADJPY Eve Bottom indication long for 108.60Eve bottom formed cadjpy daily time frame. Demand zone 105.45 & 104.75 for long target 108.60. stop loss 104.50.

CAD/JPY Running In 60 Pips 0 Drawdown,From Last Analysis,UpdatedThis Is An Educational + Analytic Content That Will Teach Why And How To Enter A Trade
Make Sure You Watch The Price Action Closely In Each Analysis As This Is A Very Important Part Of Our Method
Disclaimer : This Analysis Can Change At Anytime Without Notice And It Is Only For The Purpose Of Assisting Traders To Make Independent Investments Decisions.

How To Trade In Sideway With Real Setup On CAD/JPY Now This Is An Educational + Analytic Content That Will Teach Why And How To Enter A Trade
Make Sure You Watch The Price Action Closely In Each Analysis As This Is A Very Important Part Of Our Method
Disclaimer : This Analysis Can Change At Anytime Without Notice And It Is Only For The Purpose Of Assisting Traders To Make Independent Investments Decisions.

CADJPY | BEARS ARE STRONGCADJPY had been trading in a bullish trend but on the 22nd Sep, it broke the range and traded below the rising trendline.
Currently, it is trading in a 10 days rectangle range where a break of downside is possible.
We are expecting at least 100 pips downside move in CADJPY whenever the range breaks.
Trade your levels accordingly.

CADJPY LONGCADJPY LONG
ON THE DEMAND ZONE
IT IS JUSD IDEA!!!
If you lose money, I will not be responsible, so make your own decision!

CAD/JPY :: It is always on my targets .CAD/JPY :::
The previous analysis is still usable and you can choose the next targets by looking at it .
<<< GOOD LUCK >>>

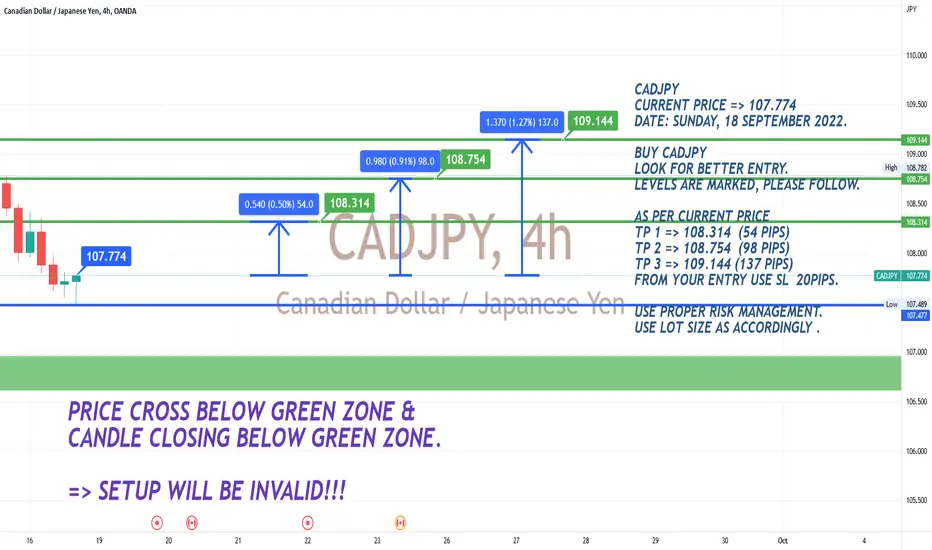
CADJPY LONG CHART ANALYSIS POSTED ON SUNDAY 18 SEPTEMBER 2022CADJPY CHART ANALYSIS !
Let's see how this pair will perform based on the analysis.
Trade safe use proper risk management always.
CAD/JPY :: wait for the best time !CAD/JPY :::
1_ Orange channel :: It is drawn in the time frame of one hour. It is currently at the ceiling of this channel, and its ceiling is a good resistance and will lead the price down to a large extent .
2_ Blue channel :: It is drawn in the time frame of 4 hours. And the price reacts a lot to the bottom of the blue channel, but has not been able to break it yet .
3_ The best decision :: wait until the price either breaks the ceiling of the orange channel or the bottom of the blue channel
4_ the targets will be as follows ::
If the roof of the orange channel is broken: range 117 .
If the bottom of the blue channel is broken: range 101 .

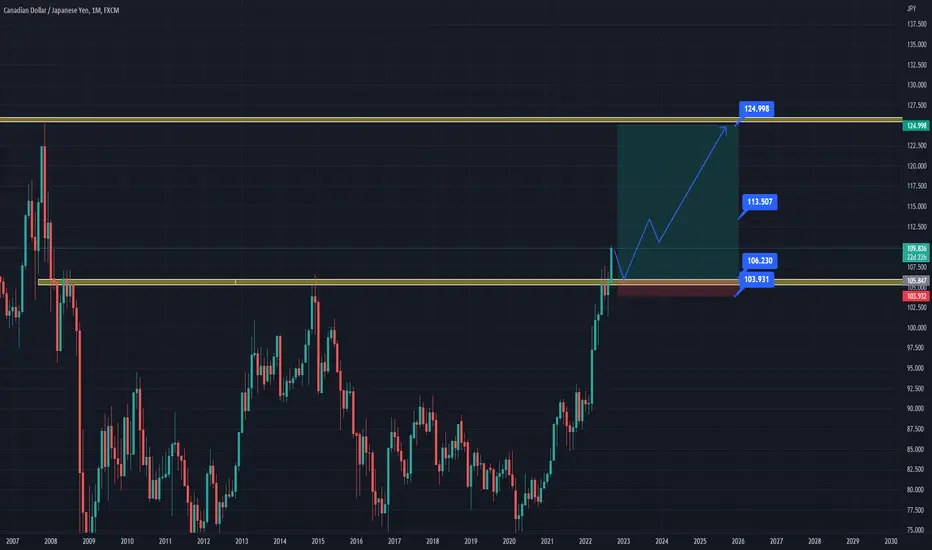
CAD/JPY ON BULL HORNSCAD has been doing great recently. With this time in the world with more caution how the tend back economically, I see no struggle in CAD holding its its stands in the Bullish Trend. With only 2% risk, we go long hoping for the all time high journey retest for CADJPY.
As always #fingerscrossedtrader

CAD JPY SET UP Ascending Triangle on CAD JPY and breakout has occur we waited for the retest which has just happened now we are looking for market reactions and candlestick pattern for entry.

CADJPY Makes 14 Year High & Likely Making More HighsWith the pair making a 14 year high and entered a short term corrections, Bulls are taking CADJPY higher with a possible target above 115.
N.B
- Let emotions and sentiments work for you
-ALWAYS Use Proper Risk Management In Your Trades


Outlook Swing Trade for CADJPY cadjpy has broken through strong resistance in the Fibonaci area, the trend is still bullish. Have a nice day

CAD/JPY Flying After Broke Res Area , Long After D Closure ?This Is An Educational + Analytic Content That Will Teach Why And How To Enter A Trade
Make Sure You Watch The Price Action Closely In Each Analysis As This Is A Very Important Part Of Our Method
Disclaimer : This Analysis Can Change At Anytime Without Notice And It Is Only For The Purpose Of Assisting Traders To Make Independent Investments Decisions.
