CADJPY shortBreak and retest of descending channel. Market structure creating higher highs and lows. Bullish price action leaving golden fib zone. Easy 30 pip target at next sell zone which is 0.382 fib.
Cadjpylong

CADJPY longRejection major bank zone and 0.618 Fib with wicks into key buy zone. Bottom of descending channel with 15M bullish engulfing.

cadjpy long for 106.45105.10 resistance broke which became support now. demand zone for long 105.30-25. stop loss 104.90, target: 106.45

CADJPY longPrice came to 1h demand zone and made bullish reversal pattern on the 15 and 30 m. This zone is also the fib golden zone.

CADJPY longThird touch of bottom side of ascending channel. Pivots are bullish with price above. 1H bullish engulfing candle. Bullish divergence seen on 15M. Rejection off 0.38% fib.

CADJPY longBullish pivots formation. Triple touch on bottom of ascending channel for the third time. Daily support is found. 1hr Demand zone is found with wicks into center. Bullish divergence found on momentum.

CADJPY shortBullish pivot with ascending channel. Falling wedge pattern found above daily pivot. Rejection off the daily support level which is also 0.382 fib.

CADJPY H1: Bearish outlook seen, further downside below 105.50On the H1 time frame, prices are testing the resistance zone at 105.50 in line with the graphical resistance where a break below the downside confirmation level at 104.80 could provide the bearish acceleration for further downside moves to the support zone at 103.50. This support zone lines up with the 78.6% Fibonacci retracement. Stochastics is testing resistance and seeing bearish divergence as well as highlighted in red where we could see further downside in prices.

CADJPY Possible bullish momentum for next week.CADJPY has been trending upside and breaks this inner resistance, this week it could continue upside or trend down.
We predict and React!!! Possible 200 Pips to the next resistance/Supply.


CADJPY trade idea (FRI - 19/08) : BUYLet's end the week strong!
CADJPY's market structure has shifted a number of times.
Look for the pull back to the 30 min demand zone and then a push (buy) to the upside.
Trade has an RR of 5.42
This is just an idea

CADJPY longEntry based on the third touch of ascending channel which is bullish and confirms the trend. On this occasion, price made a W double bottom touch at the demand zone. 1hr ADX is bullish. Momentum is bullish. Price made a 5 min bullish engulfing pattern. The 15 min gave a pin bar this area. The price is above the daily and weekly pivots. Market structure is making higher highs and lows. This should be a strong area of support.

CADJPY longPrice is trending up. There is an ascending channel. We enter at at the bottom of the channel. Price rejection off the demand zone with daily support level. Momentum is bullish. Price is above daily and weekly pivot. Weekly candle is bullish. Bullish engulfing daily candle spotted on Tuesday.

CADJPY longPrice action candles leaving a demand zone. Price above daily and weekly pivots. Price rejection of daily support

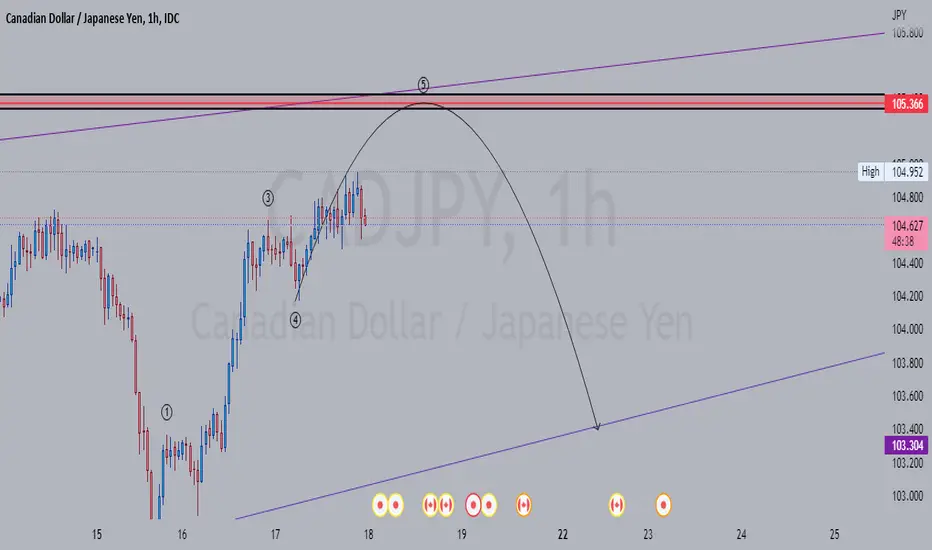
CADJPY: Elliot Price ActionHello. According to the chart and the expectation of a downward trend in the time frame, we see a distributed trend up to the specified value, which is trying for the fifth wave, and wave c will be created from the trend of wave b, and then we will have a downward trend.
Time for a long on CADJPY 💹I have a trade alert for CADJPY.
Trend trade identified and entered.
Working H1 timeframe.
Trade details can be found on the chart in printed label.
All the TP values same in label as that's what I'm aiming for on this strategy.
Trade box is tracking the trade.
Want to know how I identified this trade you know what to do.
Thanks for looking
Darren🙌

CADJPY longBullish continuation. Supply zone failed to hold price down. ADX is trending positive. Momentum is positive. Break and retest of 4hr resistance. Price is above the daily and weekly pivots. Break of consolidation channel. Market structure is making higher highs and lows.

Week 7 assignment (EXHIBIT E) for CADJPY by PROSHERIFFBULLISH ABCD PATTERN
1. Strong up trend can be expected.
2. A rejection can be seen at point D.
3. Bullish Candles have started to appear after the conformation of the pattern.
4. A tight TP is set with a take profit level of 104.700.
5. A stop loss level of 103.521 is set.
6. RR ration of 1:3 is taken for this trade.

CADJPY ! Beginning of Downtrend short trade idea 📉CADJPY 2 times test 107.600 level /Strong resistance/. Last time test price get hard dumped. My guess is beginning of CADJPY downtrend. The price retest 61.8 fibonacci level get rejection.

CADJPY hitted TAKE PROFITI posted an analysis on CADJPY yesterday and today it has gotten to my TP.
Kindly click on the follow button on my profile so you can be updated everyday on my setups from Tuesday-Thursday only.
Thanks

CADJPY shortDouble bottom rejection off key demand zone. 1hr bullish engulfing break above daily resistance. Daily resistance is also the neckline for this W shaped double bottom. 4hr candle is most a bullish engulfing candle. ADX about to flip positive. Momentum is continuation of bullish divergence patter. The price is above the daily and weekly pivot indication this is the strongest buy zone for the week as price was unable to break below the weekly pivot even after CPI move. I have my TP set at the next supply zone.

CADJPY analysisI am looking forward to go long on CADJPY as soon as I get an entry confirmation from my POI zone

CADJPY | BUY signalIn my opinion, CADJPY has stabilized itself in this range and now you can enter the BUY position using candles.
Be sure to check the previous analysis that I published earlier this week
I have given full explanations why I was thinking of buying
