Cadjpylong

CADJPY is at Major Support Potential Trade. CADJPY is at Major Keylevel am going to watch closely price action on 4hr for a potential swing to the upside.
Risk Management Alert:
The meaning of second target (Always take 60% profit of your first target and keep your 40% running to second target, in this case if any reversal happens your safe and secured,
to make this better, move your stop loss to STOP PROFIT which is above your entry level of 10-15 pips after hitting your first target, then up to you as long as it not negative, This way you don't regret holding or exiting early.
Thats 75% Profit from your idea or mine :D, Why this is good, Let's say you exited early, now you will be looking for another entry in this case you not sure if this is a reversal or a continuation of a trend and TRUST ME its not Easy to find.
Most of traders just throwing ideas without explaining why, how, and when... they just draw some beautiful butterfly's, sea-waves, waterslides, matrix moves, EVEN Some HOLY GRILL indicator, at the end all comes to risk management and key levels, Trust me markets will always do what they want to do.
Good luck.


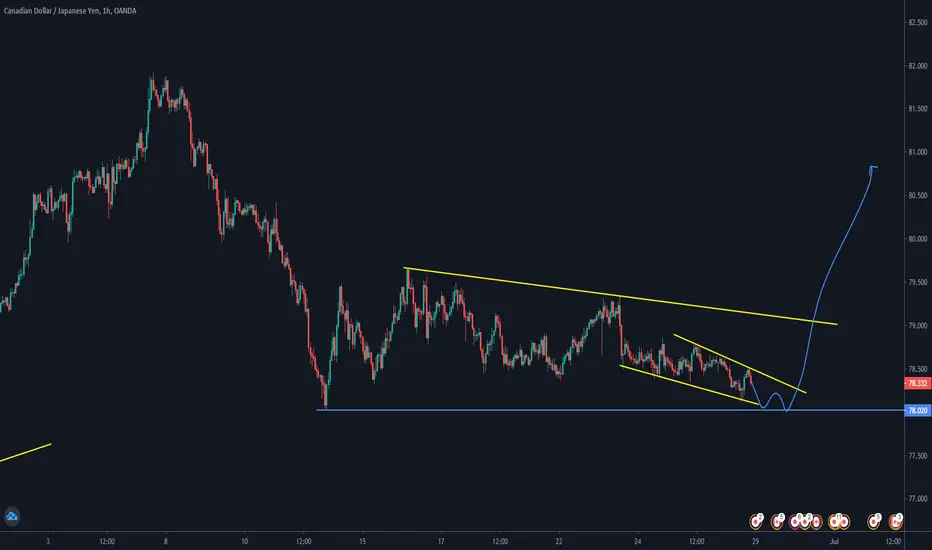
CADJPY - A long Term Buy? Following the recent employment change report on CAD which came out positive indicating strength on the currency, opportunity for the bulls to come in unfolds. However, we should expect some reaction @ 78.936 level.
If price respect that level, and fails to break through, CADJPY may become bearish. A break through the Previous Weeks High (PWH) @ 79.648 will give us a confirmation of a long-term buy targeting the monthly resistance @ 81.742.
If you find this idea insightful, hit the like button.
Happy Trading.

CADJPY Long Trade PlanHello traders, here is the trade plan for CADJPY. For trade entry details please refer to the chart. Let me know if you guys have any questions in the comment section. If you guys like my analysis please hit like. Thanks.

CAD/JPY : Looking Potential Short Opportunitylarger bear flag pattern formed and double top pattern also. looking for drop potential in downside.
ThankYou

CADJPY signal (LONG)Hello friends.
Please support my work by clicking the LIKE button(If you liked).Thank you!
Everything on the chart.
open pos: market
targets: 79.9 - 80.3 - 80.6
after first target reached move ur stop to breakeven
stop: under 79 (depending of ur risk). ALWAYS follow ur RM .
Good luck
Follow me on TRADING View, if you don't want to miss my next analysis or signals.
Good luck.
It's not financial advice.
Dont Forget, always make your own research before to trade my ideas! If i help you to earn some money i will RLY VERYVERY appreciate for your donate.
Open to your questions or suggestions(PM to me).


CADJPY SWINGTRADING LIVE ANALYSIS PROCESSFind weekly levels+value
Pay attention to the moving avarages
Find h4 zones
Find key 00 levels and halfs
use trendlines patterns fibs etc.
Find targets&Obstacles

CADJPY Trendline Retest Long SetupLooking to retest the broken descending trendline and continue to the upside. Opening longs on a pullback towards 0.618 fib retracement in confluence to the outlined support zone just below.

CADJPY LONG- Higher high and higher lows
- Rejection of TL, 50MA and 0.50 FIB
- Broken 50MA on 1hour

Forex CAD/JPY buy signals.CAD/JPY, monthly timeframe: 18 years old(!) support zone + Divergence + Hammer + Morning Star

CadJpy outlookCadJpy is trading in a 100 pip range just above important technical support that lies around 78.
With risk appetite stong into the markets, we can expect a break of the current range and a new challenge of 82.00 resistance.
A buy position at 79 would have a R:R of 1:2.5

CADJPY LONG
-CADJPY has retraced to the 50% fib level on the daily chart and consolidated there for a few weeks.
-there is bullish bias on the hourly. Bullish divergence on the 4H and hidden bullish divergence on the Daily
-I’m looking for the perfect opportunity to enter a long position on the hourly.
I’ll update if and when I enter!
Good luck !

CADJPY H4 LONG PRICE ACTION FORECASTPrice action is experiencing a downtrend momentum as correction, with MACD signaling a diminish bullish bias and about to form a sell signal for confirmation of short-term downtrend.
Expecting price action to correct and get a rejection from previous resistance level to trigger a long order capturing the forthcoming bullishness, allowing a decent R:R towards the supply zone in confluence with the ascending trendline.
The order:
Type: buy-limit
S/L: 45 pips - R:R | 1:2.7 -
T/P: supply zone
--
*** If you like the idea, don't be shy, click on like and comment. If you do not agree, just comment ;-) | Thanks for your support!!! ***

CADJPY possible long day/intraday trade opportunityCADJPY possible long day/intraday trade opportunity.

CADJPY Trend Buy!Hi traders,
We're buying CADJPY for what is setting up to be a nice continuation of a new bullish trend.


CADJPY the last one I'll be looking at nas100 more this week.We could see the cad dollar decline with a spike in covid-29 cases


CADJPY GOOD LUCK
-----------------------
Disclaimer: Forex trading and trading in other leveraged products involves a significant level of risk and is not suitable for all investors.

CADJPY H4 LONG PRICE ACTION FORECAST Price action trading with a consolidation pattern, price compression with strong rejection from the support level. MACD showing diminished bearish momentum, expecting the breakout from the descending trendline to capture a forthcoming uptrend with a long setup
The order:
Type: buy-stop.
S/L: 78 pips - R:R | 1:2
T/P: target next resistance level
