CADJPY TradingViewHere is my analysis for CADJPY on H1. The price could go bullish, you can put a pending order on the Order block or find an entry on LTF within OB Zone. Trade Safe!
Cadjpylong

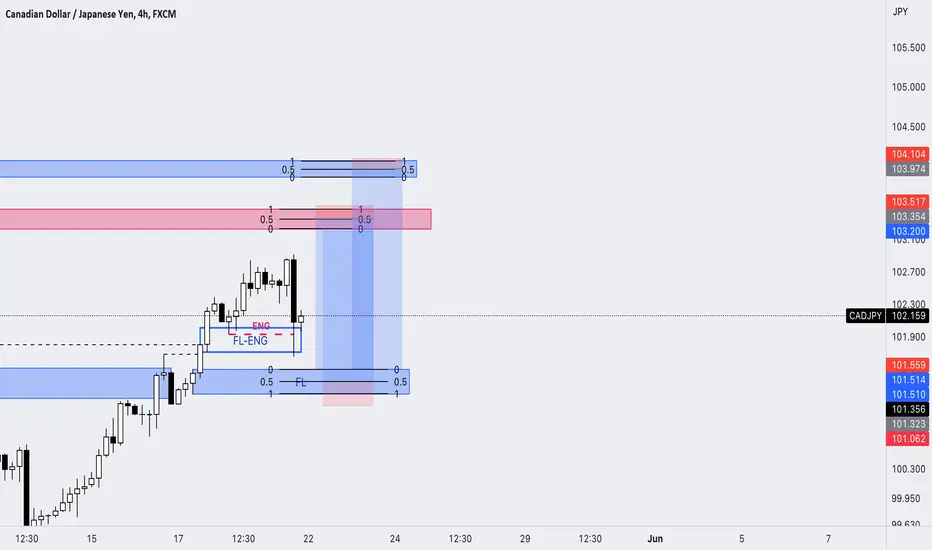
USDJPY and CADJPY Top-down analysis Hello traders, this is a complete multiple timeframe analysis of this pair. We see could find significant trading opportunities as per analysis upon price action confirmation we may take this trade. Smash the like button if you find value in this analysis and drop a comment if you have any questions or let me know which pair to cover in my next analysis.

CADJPY LONG - EXPECTING A PULLBACK!Waiting for a retest of 102.909 to Long CADJPY back to Daily key level at 104.583
If you agree drop a like and if you have any questions leave a comment :)

Buys are valid on cadjpy!!Price has broken a major high on the 1 hour. Then price made a new high which was our indication that price can go higher. Ater a new high is made we know that a pullback is needed which can either make a new low or make a higher low. In this case we have a higher low which means that we can expect a return to our new high. Seeing that the bulls are in control of the market at this time I entered in two positions.

BUY TRADE SETUP ON CADJPYHey Traders,
Check this trade analysis out on CADJPY.
A possible bullish run can be look for at any area of breakout of the symmetrical triangle.
Watch out.

CADJPY AnalysisAs I study the economy of Japan, its economy is strong, but they did not increase their interest rate. So in this situation, I think Yen will remain weak. Better to look buying opportunity on this pair.

CADJPY LONG - WAITING FOR PULLBACK!Waiting for a retest of 101.427 to long EURJPY back to daily key level at 104.482
If you agree drop a like and if you have any questions leave a comment :)

ready to bang cadjpycadjpy (one of my beloved minor quotes) is in accumulation phase. I'm ready to take action as soon as cadjpy reaches to one of mu support/demand zones.
⚠️ Notice:
I will enter one third of my position when price touch the box and the rest of it in the middle of the box. My TP would be R/R=3 and 5.
Please trade with your own money management methodology and be aware that trading has its own risks and rewards.
Good luck ❤️
CADJPY - Long after filling the imbalance ✅Hello traders!
‼️ This is my perspective on CADJPY.
Technical analysis: Here we are in a bullish market structure from 4H timeframe perspective, so I am looking for longs. I expect price to go a little bit lower to fill the imbalance and then to reject from bullish order block + institutional mid figure 101.500.
Like, comment and subscribe to be in touch with my content!

My opinion On CAD/JPY. CAD/JPY Has Been in a uptrend this past week. and Its been having beautiful Market Structure as well. I believe CAD/JPY will break above the zone & continue in a uptrend. Keeping it simple is the way to go. Find a trend & wait for the breakout & enter in the pull back . Its not always gonna pull back for a entry, But that's just part of the Game & being patient!

CADJPY TradingView H1Here is my view for CADJPY on H1. The price could go bullish, you can put a pending order on the Order block or find an entry on LTF within OB Zone. Trade Safe!

CADJPY TradingView H1Here is my view for CADJPY on H1. The price could go bullish, you can put a pending order on the Order block or find an entry on LTF within OB Zone. Trade Safe!

CAD/JPY - Trade Setup Structure: Solid power move to the support zone aligned with the 200 MA Strategy
Trade: Long
Risk/Reward: 1:1
Disclaimer: DYOR!

CAD/JPY - Trade Setup Structure: Solid power move to the support zone aligned with the 200 MA Strategy
Trade: Long
Risk/Reward: 1:1
Disclaimer: DYOR!

CADJPY setting itself for upsideAscending Triangle is forming on the CAD/JPY.
We have had a few fakeout breakouts above. Nothing too promising yet.
But we are seeing higher lows and that is comforting for the price to continue up.
7>21 - Bullish
Price<200 - Price reaching 200MA elastic area.
RSI>50
Target 106.00
Bullish by nature

CADJPY LONG - WAITING PATIENTLY!Waiting for a retest of 98.729 to long CADJPY back to 4H swing highs at 101.606
If you agree drop a like and if you have nay questions leave a comment :)

CADJPY HERE !manish here
cadjply pridection
after mitigate its previous demand it will move up to its 4 hr supply zone

CADJPY Top-down analysis Hello traders, this is a complete multiple timeframe analysis of this pair. We see could find significant trading opportunities as per analysis upon price action confirmation we may take this trade. Smash the like button if you find value in this analysis and drop a comment if you have any questions or let me know which pair to cover in my next analysis.

CADJPY(06/05/2023)Open Position : 100.00
Take Profit : 102.400,101.700
Stop lost : 98.250
Best regards

Best 2 Places To Buy CAD/JPY To Catch The Next 400 Pips !This Is An Educational + Analytic Content That Will Teach Why And How To Enter A Trade
Make Sure You Watch The Price Action Closely In Each Analysis As This Is A Very Important Part Of Our Method
Disclaimer : This Analysis Can Change At Anytime Without Notice And It Is Only For The Purpose Of Assisting Traders To Make Independent Investments Decisions.

CAD JPY SET UP Hello guys,
CAD JPY has been moving in an ascending channel, and the price has reached the support trend line. Do you think the price will break through or bounce? I expect a bounce, so I'm waiting for the BUY confirmations.
If the price breakthrough, I will be looking to go short after the retest of the broken support level, tell me what you think guys.

CADJPY Long Position Demand ZoneHi
CADJPY(Canadian Dollar Vs Japanese Yen) is in Good Demand Zone and We hope a good Position
Entry:98.347
SL:97.525
TP:104.212
RR= 1:7

CADJPY here !!we can on weekly and daily chart w pattern chreated
so maybe a good move we can see in future
