CADJPY H1 : Bearish Scenario!The 1-hour timeframe shows that after grabbing trend liquidity, the price reaches an unmitigated order block, which could drop the price from 107.84 to 107 or lower
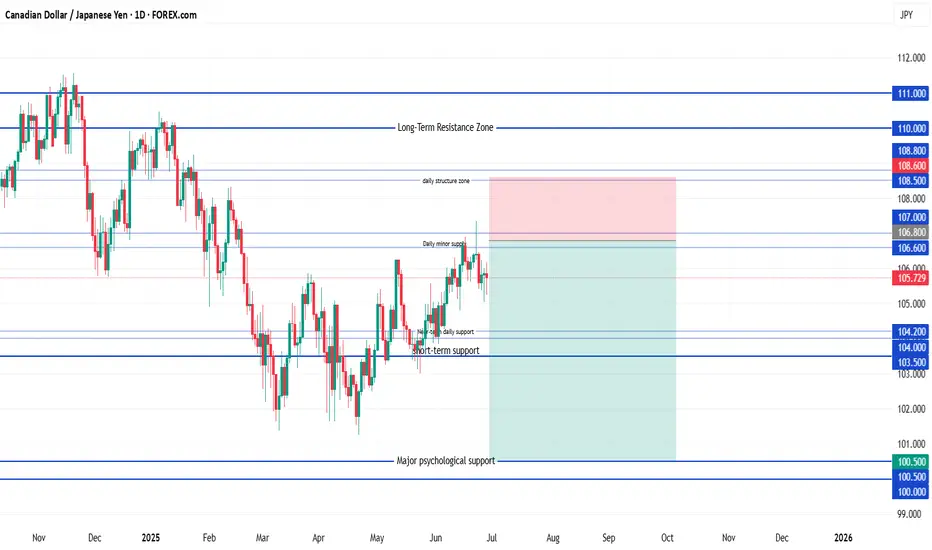
Cadjpyshort

CAD/JPY ShortSell Limit Entry: 106.80
(Just under the resistance trap zone: 106.60–107.00)
Stop Loss: 108.60
Target 1: 104.20
(First minor support zone)
Target 2: 103.00
(Deeper support + recent structure base)
Target 3 (Optional hold): 100.50
(Long-term structural support zone)
CADJPY SELLBy utilizing levels, historical patterns, , we can formulate a hypothesis that the market might follow a similar trajectory if bearish sentiment prevails.

CADJPY - Looking To Sell Pullbacks In The Short TermM15 - Strong bearish move.
No opposite signs.
Currently it looks like a pullback is happening.
Expecting bearish continuation until the two Fibonacci resistance zones hold.
If you enjoy this idea, don’t forget to LIKE 👍, FOLLOW ✅, SHARE 🙌, and COMMENT ✍! Drop your thoughts and charts below to keep the discussion going. Your support helps keep this content free and reach more people! 🚀
--------------------------------------------------------------------------------------------------------------------

CADJPY Bearish Breakout!
HI,Traders !
#CADJPY made a bearish
Breakout of the rising support
Which is a resistance now and
The breakout is confirmed
So we are bearish biased
And we will be expecting
A further bearish move down !
Comment and subscribe to help us grow !

Bearish Bias Holds as Oil Rises & Rate Differentials NarrowUSDCAD – Bearish Bias Holds as Oil Rises & Rate Differentials Narrow
🌍 Macro & Fundamental Outlook
The Canadian Dollar (CAD) continues to gain ground this week, supported by two key drivers:
Crude oil prices surged due to Middle East tensions and renewed demand optimism — boosting CAD as a commodity-linked currency.
US-Canada yield spreads narrowed, following revised expectations that the Bank of Canada (BoC) may keep rates higher for longer, while the Fed is seen pausing.
Short-term event risks to watch:
🇨🇦 Canadian Manufacturing Sales data today at 13:30 GMT
🇨🇦 G7 Summit in Alberta from June 15–17, which may influence oil and energy policy sentiment
Our latest fair value estimate for USDCAD has shifted lower to 1.3613, reflecting tighter rate spreads and stronger oil. Technical structure remains tilted to the downside.
📉 Technical Outlook – M30 Chart
🔹 Structure:
Price remains in a short-term downtrend, with a well-defined descending trendline capping upside attempts.
The pair recently tested the EMA 89–200 zone and failed, suggesting continued bearish pressure.
🔹 Key Zones:
Dynamic Resistance: 1.3638 – 1.3660 (trendline + EMA cluster)
Support Area: 1.3592 → 1.3578
A break below 1.3578 could expose deeper downside toward 1.3420 (September lows)
🔹 Momentum Indicators:
RSI has bounced from oversold (30) but remains in bearish territory.
The current rebound looks corrective — potentially a dead cat bounce.
🧠 Market Sentiment
Flows favour commodity-backed currencies like CAD, especially with energy prices rising.
USD has weakened slightly as the Fed is expected to hold rates steady next week.
Sentiment is leaning toward "sell the rallies" on USDCAD for now.
🎯 Trade Setup Scenarios
🔻 SELL SCENARIO – If price retests and rejects 1.3638 – 1.3660
Entry: 1.3640 – 1.3655
Stop-Loss: 1.3685
Targets: 1.3592 → 1.3578 → 1.3510
🔺 BUY SCENARIO – If strong bullish reaction occurs at 1.3592 – 1.3578
Entry: 1.3580
Stop-Loss: 1.3545
Targets: 1.3620 → 1.3640
⚠️ Focus on trend continuation. Only consider buys if clear rejection or bullish confirmation appears at support.
✅ Conclusion
The current trend in USDCAD favours sellers, with fundamental momentum supporting CAD via higher oil and narrowing yield differentials. Key resistance at 1.3638–1.3660 remains the pivot zone to monitor. With Canadian data and the G7 Summit ahead, volatility could increase.

EURJPY and other crossesYou can see that JPY has becoming stronger over the last couple of days, and today it broke previous structure and broke above the recent low.
If this continues, we will see the JPY crosses continue to head lower.

CAD JPY Entry Setup 1 hour timeframe CAD JPY Entry Setup
Bearish break and retest
Candlestick confirmation: Doji and clow below
Risk to Reward: 1:3

CAD JPY Entry Setup 1 hour timeframe CAD JPY has formed a bearish break and retest pattern that also align with the 0.50 - 0.618 Fib Retracement, this level has also acted as a very strong resistance level in the past.

Short CADJPY - a little more patience requiredI have been waiting and watching this pair on the daily t/f for several weeks now. Like some people like to say "waiting like a sniper", lol.
Seriously, I became more interested since it formed a flat bottom because I like to trade BO (breakouts) or BO with a pullback. Note that this is a daily chart and price is below the 200sma.
I expect price to continue to make lower highs and break out to occur late this week, possibly next week. Hopefully, you have your own plan on how you trade breakouts. Good luck if you will trade this.
This is not a trade recommendation; it’s merely my own analysis. Trading carries a high level of risk, so only trade with money you can afford to lose and carefully manage your capital and risk. If you like my idea, please give a “boost” and follow me to get even more. Please comment and share your thoughts too!!
It’s not whether you are right or wrong, but how much money you make when you are right and how much you lose when you are wrong – George Soros

CAD JPY Sell Trade Setup H1CAD JPY has not fully dropped into the demand zone yet but its creating a bearish break and retest pattern that also align with the 0.50 - 0.618 Fib Retracement level.
Once this pattern is confirmed we will be selling into the demand zone.

Tue 1st Apr 2025 Daily Forex Charts: 4x New Trade SetupsGood morning fellow traders. On my Daily Forex charts using the High Probability & Divergence trading methods from my books, I have identified 4x new trade setups this morning. As usual, you can read my notes on the charts for my thoughts on these setups. The trades being a CAD/JPY Sell, GBP/CAD Buy, EUR/AUD Buy & a USD/CAD Buy. I also discuss some trade management. Enjoy the day all. Cheers. Jim

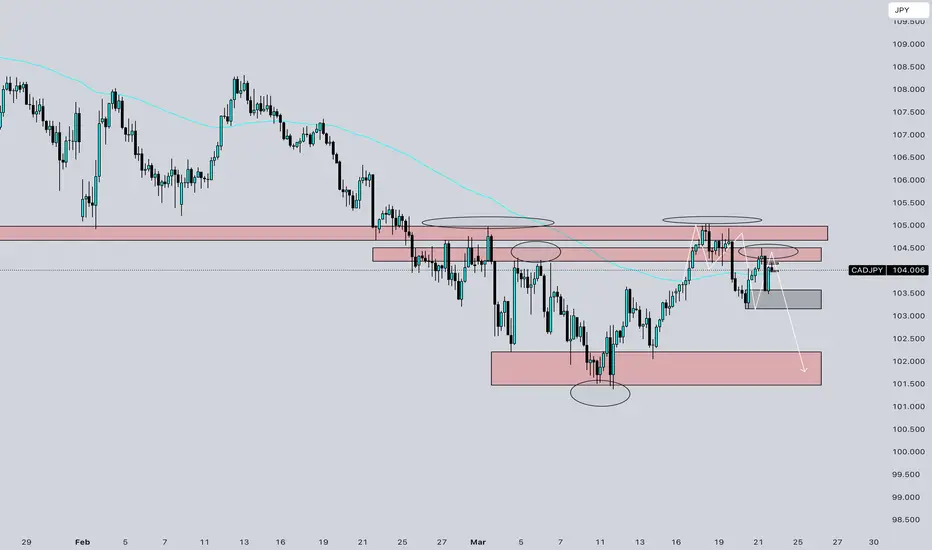
CADJPY analysis for a Sell!!!!Here’s a sell-side analysis for CAD/JPY on the 2H chart based on your updated screenshot:
⸻
Pair: CAD/JPY
Timeframe: 2H
Current Price: ~104.656
Market Bias: Short-term bearish shift from previous bullish trend
⸻
Sell Analysis Overview:
1. Bearish Structure Forming Below 105.300–105.600
• Price recently broke below a major support zone (~105.300–105.600), which is now turning into a resistance zone.
• This rejection aligns with the concept of structure flipping — previous support now acting as resistance.
• The marked “Sell Structure Forming Below” zone highlights this key area for short positions on pullbacks.
2. Multiple Rejections at 105.866
• There are clear lower highs forming, with repeated rejections around 105.866 (circled).
• Each attempt to push higher has failed, showing strong bearish pressure and exhaustion from buyers.
3. Breakdown of Key Moving Averages
• Price has closed below both the 50 EMA and 100 EMA, which are beginning to curl downward — a common signal of a trend reversal.
• Momentum has shifted, and sellers are currently in control.
4. Liquidity Grab + Breakdown
• After a false breakout to the upside, price grabbed liquidity around 105.866 and quickly reversed.
• This aligns with smart money behavior: sweeping highs before dropping — a classic bearish trap.
5. Short-Term Target Zone
• The current bearish move has a clear downside target in the 103.600–103.800 zone, which is marked as an “Area of Liquidity”.
• If this zone breaks cleanly, extended targets sit around 101.800–101.400, where fresh demand and buy structure are likely to form.
⸻
Sell Plan & Risk Management:
• Entry Idea: Wait for a pullback into the 105.300–105.600 zone to look for bearish confirmation (e.g., bearish engulfing, rejection wick).
• Stop Loss: Above 105.866 (invalidates structure)
• Take Profit Levels:
• TP1: 103.600 (liquidity zone)
• TP2: 101.800 (demand zone)
• TP3: 101.400 (long-term structure support)
⸻
Final Thoughts:
CAD/JPY is now showing early signs of a bearish trend reversal after a clean breakdown of structure and liquidity sweep at highs. As long as the price remains below 105.600, the bias remains bearish. A bounce from 104.500 could temporarily delay the drop, but deeper downside is likely if that level gives way.

CADJPY Analysis For A SELL Idea!!!!CADJPY - 4H Chart Sell Analysis
Market Structure
• The overall structure is bearish, with price forming lower highs and lower lows.
• Price attempted to rally but failed to break above 105.000, a major supply zone and previous support turned resistance.
• The most recent push above the highs appears to be a liquidity grab, followed by a strong rejection.
Supply & Resistance Zones
• Price reacted strongly to a key supply zone around 104.500 - 105.000.
• Multiple rejections and wicks in this zone suggest heavy selling interest.
• A fake breakout (bull trap) is visible, where buyers got trapped above resistance before a bearish move resumed.
Price Action Confirmation
• The bearish engulfing candle after the liquidity grab suggests a potential shift in momentum.
• Price broke below a minor support level and is currently retesting it, aligning with a lower high formation.
• The 50 EMA (blue line) is acting as dynamic resistance, further supporting the bearish bias.
Target Zones
• First target: 103.000 – a key intraday support and minor demand zone.
• Main target: 102.000 - 101.800 – a strong demand area and previous low where price may look to rebalance and tap liquidity.
Trade Setup
• Entry: Around 104.000 - 104.100 after a confirmed retest of broken support.
• Stop Loss: Above 104.500 - 104.700, outside the recent supply zone.
• Take Profit: Partial at 103.000, final TP at 102.000.
Confluences
1. Bearish trend continuation.
2. Liquidity grab above previous highs (105.000 area).
3. Rejection from major supply zone.
4. EMA resistance and structural confirmation of lower high.
Final Outlook
• If price stays below 104.300, sellers likely maintain control.
• A clean break below 103.500 will confirm further downside.
• A move and close above 105.000 would invalidate this sell setup.
CADJPY: Bearish Outlook as BOJ Stays HawkishHey Realistic Traders! BOJ’s Hawkish Stance, Will OANDA:CADJPY Turn More Bearish? Let’s Dive into the Analysis...
Technical analysis
On the H4 timeframe, CAD/JPY has repeatedly tested the 200 EMA but struggled to stay above it for long, indicating a strong bearish trend. Even the latest price correction failed to break above the 0.5 Fibonacci retracement level. Afterward, the price formed a bearish rising wedge pattern, followed by a breakout. The MACD indicator also signaled a bearish crossover, reinforcing the likelihood of further downside.
Looking ahead, CAD/JPY could drop toward the first target at 101.505 and, if selling pressure persists, potentially reach the second target at 100.159. These levels align with previous price movements and key historical support zones.
However, this bearish outlook remains valid only if the price stays below the key stop-loss level at 105.133.
Market Sentiments
Japan’s Bank of Japan (BOJ) is keeping its short-term interest rate steady at 0.5% while monitoring domestic wage growth and rising food prices. If inflation continues to rise, the BOJ may increase rates, potentially to 0.75% or higher, which could strengthen the yen and potentially make the CADJPY going lower.
Support the channel by engaging with the content, using the rocket button, and sharing your opinions in the comments below.
Disclaimer: "Please note that this analysis is solely for educational purposes and should not be considered a recommendation to take a long or short position on CAD/JPY"

SHORT ON CAD/JPYCAD/JPY is currently at a major resistance level/zone and has formed a minor double top just breaking the neckline on the lower timeframes.
I will be selling cad/jpy to the next major swing low for about 200 pips.

CADJPY TRADE IDEAPrice is currently on a downtrend, awaiting price to take out inducement and activate on the 1 hour or 30 mins order block marked to continue the sell

CAD JPY Entry Setup 30 mins timeframe Bearish Break and Retest
Pattern confirmed.
Now we wait for candlestick confirmation. ⏰

USDCADLooking Ahead: USD/CAD Forecast for the Coming Years
When analyzing the future outlook of USD/CAD over the next few years, several key factors come into play, including economic policies, commodity prices, and overall market sentiment.

CADJPY Short4 hour created a higher lower with a 15 min double top break of neckline, possible continue to the downside. tp prices called

SHORT ON CAD/JPYCAD/JPY is currently in its pullback phase seeking liquidity for its next rise up.
I will be selling to the nearest demand level then I will be looking for price to change structure to get in for a buy.

Setup #005 - CADJPY - LongTrade entered.
Confluences:
✅ Bullish overall bias
✅ Bulllish demand zone
✅ Bullish crab on 15 min chart, bullish impulse crab on H4
✅ Bullish divergence in price reversal zone
✅ Buillish break of structure
✅ Entering London close zone
✅ Break of structure confirmed
✅ Required risk:reward met

Setup #004 - CADJPY - LongWaiting for order fill. Must come between 10am-12:30pm ET today.
Confluences:
✅ Bullish overall bias
✅ Bulllish demand zone
✅ Bullish crab on 15 min chart, bullish impulse crab on H4
✅ Bullish divergence in price reversal zone
✅ Buillish break of structure
✅ Entering London close zone
✅ Break of structure confirmed
✅ Required risk:reward met
