Trading Idea Regarding CADJPYAccording to my analysis this currency pair is going down\
1-Raising Wedge Chart Pattern
2-Divergence
3-Strong Resistance Key Levels
Cadjpyshort

CADJPYHello traders. Due to the failure of the daily trend line and pullback, we are waiting for confirmation for sale. Be profitable

CADJPY Down Trend.!#CADJPY Hello trader, I hope are good and safe. Today I opened the chart of #CADJPY for 15 Min and analyzed it then I see that this chart has made a DOWN TREND, So I hope #CADJPY will go downside,
Now Nice opportunity for short.
If you have any query then leave a COMMENT, LIKE and FOLLOW.
Keep Supporting And Thank You..

CADJPY bearishSame expection on CADJPY compare to CADCHF, waiting for a retracement before entering a short position


CADJPY sell after pull back to 61.8 Waiting for a pullback on CADJPY to the breakout and 61.8 fib level before we sell down to the support and final tp of 88.820

CADJPY Down Trend.!#CADJPY Hello trader, I hope are good and safe. Today I opened the chart of #CADJPY for 15 MIN. and analyzed it then I see that this chart has made a DOWN TREND, So I hope #CADJPY will go downside,
Now Nice opportunity for short.
If you have any query then leave a COMMENT, LIKE and FOLLOW.
Keep Supporting And Thank You..

Trading Idea Regarding CADJPYAccording to my analysis CADJPY is going Bearish For Upcoming Week
1- As it made W Shape Chart Pattern break above the Neck Line and go up.... Now Price is going to retest the neck line that has made on daily time frame
2- Price is making nice Quasimodo chart pattern on 4 Hour Time Frame also Suggest it Bearish behavior for the upcoming week
3- Price has break above from 200EMA its possible that it will retest the 200EMA after Breakout

CADJPY Short Analysis Hey traders, here is the analysis for the CADJPY. Let me know if you guys have any questions in the comment section. If you guys like my analysis please hit like. Thanks. NOTE - Please do your own analysis before taking the trade.

CADJPY SHORTS 📉📉📉📉Expecting bearish price action on this pair as price made a shift in the market strucutre from bullish into bearish, retraced back into a bearish orderblock on h4 + imbalance fill and rejected from there with a nice h4 bearish closure. I think we go for another leg to the downside.
What do you think ? Comment below..

CadjpyHello. Due to the twin floor formation and positive divergence and neck line failure, I predict a price of 61.8% or 78.6% before the move.


CADJPY SHORTSupply OB
Compression near the OB
BOS below
TL liquididity and AL liquidity to target
SL above swing high
Target the swing low
RSI hidden divergence

Short CAD/JPYPossible short opportunities on CAD/JPY , look for bearish candlestick pattern along support zone ...Stoploss must be above support zone, make sure to wait for bearish candlestick pattern to validate entry..

CADJPY shortDon't forget to click on the Follow button for more daily detailed analysis, Also if you have any questions, please do ask them!
We are looking to short the CADJPY back to reasonable support.
Exit area is at the eclipse symbol.

#CADJPY Double Top #CADJPY Hello everyone, and welcome to my TradingView profile, my name is TRADiNG_Club_ and today I am going to analyze #cadjpy a full technical analysis on different time frames using a translation of market information While doing so, let me give you a personal opinion about it. The next most likely market movement and helps you find and manage market opportunities.
My thoughts are for those who are interested in improving their financial education.
Thank You..

CADJPY ShortI see a BEEAUTIFUL setup for Cadjpy here. This short setup looks of a 95% gurantee for me. From Cadjpy's current price setup i expect a sell off of more than 100 pips. Stop loss would be at the previous high. Cadjpy will land at 90.08 support level. Good luck traders!

CADJPY 200 Pip shortPrice is overall still in a consolidation from December 2021. Beginning 2022 we hit the extremes of last months consolidation and we´re right now at a Key level to trade back into the Consolidations Liqudiity point of December.
Small Risk Trade R to R is 1 : 6,2 // price could also go up one more time to close above the Key level, if this happens ill´Stop out and plan a new trade.
My Overall Target is 89.200, due to Bullish Seasonality, I´ll use some of my Short Profits to Hedge for a Double Break. MY Long Hedge will start 89.200 scaling in as low as price goes without hitting my stop loss on the long position.


FOREX ANALYSIS : CADJPYFX:CADJPY
The blue and red lines mean: I think prices can return in these areas.
Green lines mean: I think the price can reach these areas. They are therefore known as transaction targets.
If you want to use this deal, please risk only one percent of your account balance.
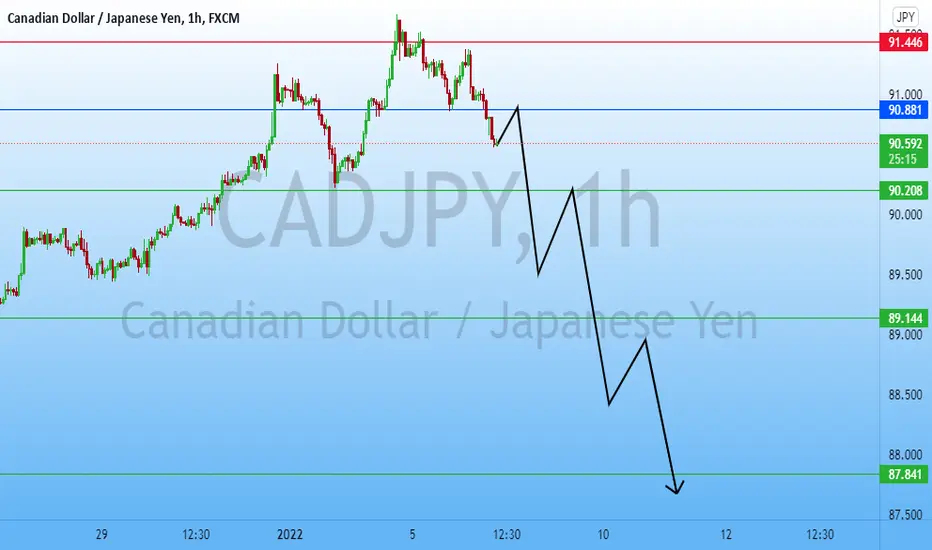
CAD/JPY UPDATE ! SHORT TO 89.000An update to CAD/JPY , based on Friday data from JPY we can see a bearish movement to 89.000

CADJPY Short (Daily/Weekly Analysis)CADJPY rejected an important Daily/4H resistance level after faking-out above it (which corresponds to a Weekly/Monthly wick) the SL will be put to break-even when price reaches 90.240 level, as it has acted as a strong support/resistance in the past and price could bounce up from there. The Final target is 87.800.

CAD/JPY NEXT SHORT MOVEMENT ? PROFITS AROUND 89.000If this pair refuse the 91.463 we could see a head & shoulders pattern who might end at 89.000-89.150
