CADJPY Analysis H4Here is my analysis for CADJPY on H4 using Order Block. The price could go bullish, you can put a pending order on the Order block or find an entry on LTF within OB Zone. Trade Safe!
Cadjpytrade

CAD JPY BATSo, we have a complete bat, and it's a biggy. So far it has behaved itself but this particular pattern can be tough as to where to gauge a SL. I've opened my sell and you can see my TP's. Ideally, you should wait for the candle to close below the previous week high, retest and then drop.
Published 25th September 2023 17:00 UTC+1

Daily Wave Rider - CADJPY - BUYCADJPY
Channel: GREEN
WK Pivot: GREEN
AOB: EMA10
CON: SBB
BUY Stop: 110.446
Stop Loss: 109.347
TP01: 111.545
TP02: 113.743
DWR present as a buy setup on 25SEP, with Channel and Pivot are green bouncing of EMA10
However, trade is not taken/considered as it is Monday which is normally correction day and market is unpredictable
SPX500: BUY
DXY: SELL
OIL: SELL
GOLD: SELL

CADJPY BUYS in play.CADJPY BUYS in play.
1. Potential Bullish Trend.
2. CAD is strong meanwhile JPY is weak.
3. Short term sellers pressure.
We are looking to go Long on this pair, As the price is heading towards the support and resistance zone. We will look for confirmations on the lower time frames.

#CADJPY- UPDATE OUR POV CHANGED!!We were bearish up until this week friday, though JPY showed massive rejection and failed to take control of the price, which indicates prices are expected to rise and stay bullish for now.
Let's wait for the market to show the move!!

CADJPY Long Term SELLING Trading IdeaHello Traders
In This Chart CADJPY HOURLY Forex Forecast By FOREX PLANET
today CADJPY analysis 👆
🟢This Chart includes_ (CADJPY market update)
🟢What is The Next Opportunity on CADJPY Market
🟢how to Enter to the Valid Entry With Assurance Profit
This CHART is For Trader's that Want to Improve Their Technical Analysis Skills and Their Trading By Understanding How To Analyze The Market Using Multiple Timeframes and Understanding The Bigger Picture on the Charts

CADJPY BuyAs we all know that the economic condition of Japan is not fine, and they are also facing natural disasters. I still believe that Yen will remain weak in coming week. Better to look buying opportunities on such pairs which have YEN.

CADJPY Bearish Wedge Pattern!CAD-JPY is trading in an
Uptrend but the pair has
Formed a bearish wedge
Pattern and is trying to make
A bearish breakout so I think
That If the breakout is confirmed
Then we can expect a local
Bearish move down !

CADJPY 1000 PIPS SELLING Opportunity❤️Hey Everyone, hope all of you had great weekend, after looking most of the JPY pairs, it is clear that all of them recently overbought due to JPY weakening day by day since last 2-3 months. However, a strong bearish Impulse is expected.
Price needs to show an indication of strong bearish behaviour before finalising or taking any further actions.
Good Luck And Trade Safe❤️

CADJPY Analysis H1Here is my analysis for CADJPY on H1 using Order Block. The price could go bullish, you can put a pending order on the Order block or find an entry on LTF within OB Zone. Trade Safe!

CADJPY Buy H1Here is my analysis for CADJPY on H1 using Order Block. The price could go bullish, you can put a pending order on the Order block or find an entry on LTF within OB Zone. Trade Safe!

CADJPY Bearish Bias!CAD-JPY has hit the
Horizontal resistance
Of 107.0 from where we
Are seeing a bearish
Reaction and I think
That the pair will go
Further down!

CADJPY Analysis H1Here is my analysis for CADJPY on H1 using Order Block. The price could go bullish, you can put a pending order on the Order block or find an entry on LTF within OB Zone. Trade Safe!

CADJPY - Long from bullish order block ✅Hello traders!
‼️ This is my perspective on CADJPY.
Technical analysis: Here we are in a bullish market structure based on higher timeframe, so I am looking for longs. My point of interest is if price makes a retracement to fill the imbalance lower and then rejects from bullish order block.
Like, comment and subscribe to be in touch with my content!

CAD/JPY - LONG; Buy it up!This should be self explanatory. The Loonie should also benefit - including for the long run! - from the global re-centralization toward NAFTA.

CADJPY LONG TERM TRADING IDEAHello Traders
In This Chart CADJPY HOURLY Forex Forecast By FOREX PLANET
today CADJPY analysis 👆
🟢This Chart includes_ (CADJPY market update)
🟢What is The Next Opportunity on CADJPY Market
🟢how to Enter to the Valid Entry With Assurance Profit
This CHART is For Trader's that Want to Improve Their Technical Analysis Skills and Their Trading By Understanding How To Analyze The Market Using Multiple Timeframes and Understanding The Bigger Picture on the Charts

CADJPY - Short after filling the imbalance ✅Hello traders!
‼️ This is my perspective on CADJPY.
Technical analysis: Here we are in a bearish market structure from 4H timeframe perspective, so I am looking for short position. I want price to continue the retracement to fill the imbalance higher and then to reject from bearish order block
Like, comment and subscribe to be in touch with my content!

CADJPY I BOC Rate Statement Trading PlanWelcome back! Let me know your thoughts in the comments!
** CADJPY Analysis - Listen to video!
We recommend that you keep this pair on your watchlist and enter when the entry criteria of your strategy is met.
Please support this idea with a LIKE and COMMENT if you find it useful and Click "Follow" on our profile if you'd like these trade ideas delivered straight to your email in the future.
Thanks for your continued support!

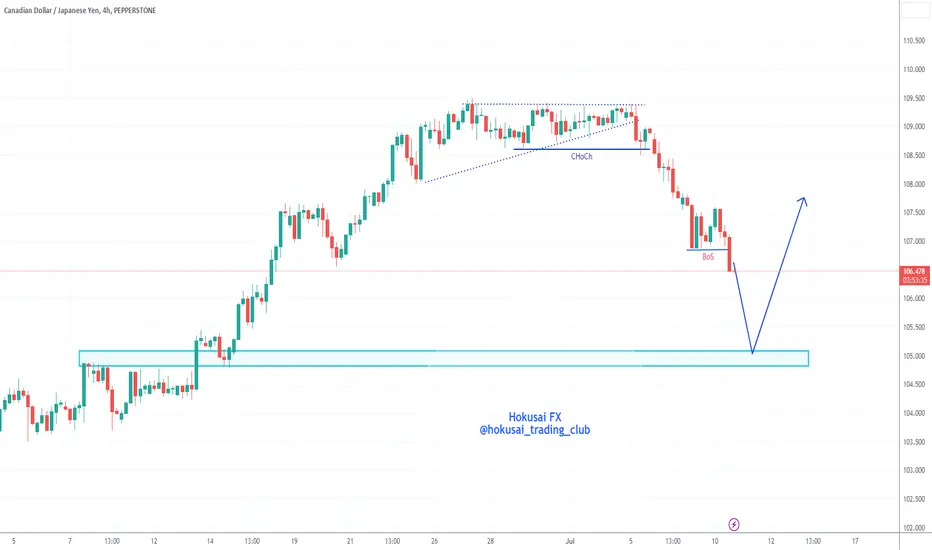
CADJPY Analysis 10July2023I believe for this pair that the bullish trend has collapsed, the trend is turning bearish for now. usually after a trend collapse, the price will correct back to near the previous HH, it's a good idea to place pending orders in the area you have marked.
CADJPY Analysis H4Here is my analysis for CADJPY on H4 using Order Block. The price could go bullish, you can put a pending order on the Order block or find an entry on LTF within OB Zone. Trade Safe!

CADJPY Breakout Trade SetupCADJPY is about to break its range please place buy and sell order to take trade.
Manage your risk accordingly.
