SELL CADJPYHi fellow traders, CADJPY has reached the blue box after completing this large WXY correction. Look for a sell opportunity anywhere from this area. Target the wave 'X' low. Good luck and trade safe!
Cadjpytradingsetup

CAD JPY Short Setup Bearish Divergence OANDA:CADJPY
CAD JPY Short Setup Bearish Divergence - Also Break of Rising Wedge
Sell Stop Entry place break of L.L

CADJPY Signal 27June2023price is seen breakingout the H1 trendline with a fairly full bearish candle. I see this as one of the minor bearish signs.

CADJPY Resistance Breakout SetupCADJPY currency pair breakout trade on resistance side, You can also place Sell stop below resistance line or wait for breakout.

Buys are valid on cadjpy!!Price has broken a major high on the 1 hour. Then price made a new high which was our indication that price can go higher. Ater a new high is made we know that a pullback is needed which can either make a new low or make a higher low. In this case we have a higher low which means that we can expect a return to our new high. Seeing that the bulls are in control of the market at this time I entered in two positions.

CADJPY SELL AGAINHi fellow traders, CADJPY has completed an ABC correction after the last drop. Look for a sell opportunity from the blue box area. Target the support levels. Good luck and trade safe!

CADJPY : Current Situation & Technical , Fundamental View#CADJPY
- CADJPY is currently selling after a STRUCTURE BREAK because the current MARKET SENTIMENT is NEUTRAL. Somehow, JPY is becoming somewhat STRONG. Similarly, the YEILD given by the BOJ to JP10Y increased, making the JPY STRONG.
- The reason for that is because the Central Bank of Japan did not intervene in the long term to strengthen the JPY, they are strengthening the JPY in other ways without raising the rate. Meanwhile, the price of OIL has gone down a bit, so the CAD has become very weak in the last few days. Anyway, as expected in the BOC RATE DECISION the other day, the RATE HIKE was done.
- But somehow the CANADIAN CENTRAL BANK has become HAWKISH. Therefore, CADJPY should definitely be slightly UP until the 103.110 LEVEL. Before that, there is definitely a very high possibility to sell to the 95.92 LEVEL. So FOLLOW STRUCTURES. If JPY becomes strong, it can sell at 93.01 level.

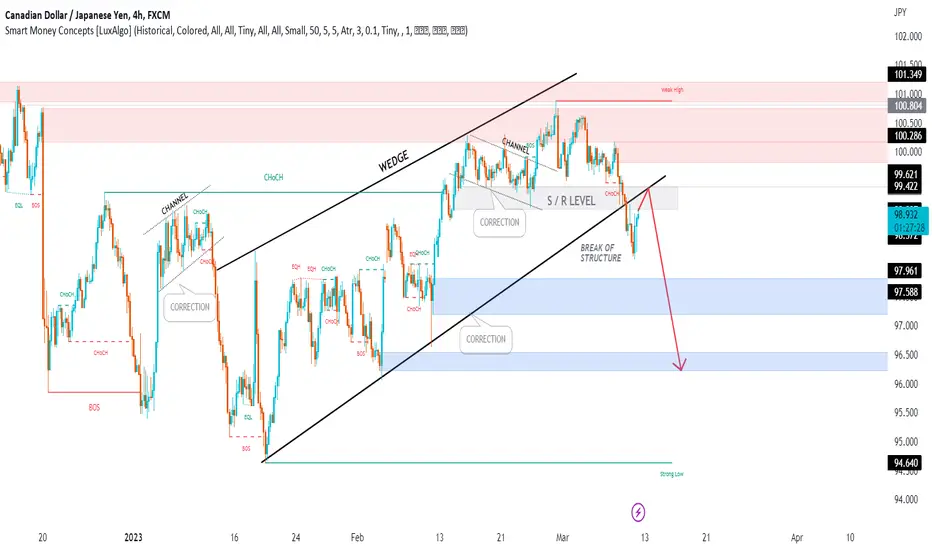
CADJPY Next Possible Move ? Pair : CADJPY ( Canadian Dollar / Japanese Yen )
Description :
Rising Wedge as an Corrective Pattern in Long Time Frame with the breakout of the Lower Trend Line and Retracement
Divergence
Consolidation Phase
Break of Structure , Broke the Previous S / R and Retested
Bearish Channel
CADJPY: Trading Plan - 8/Mar/2023Hello Traders,
Hope you all are doing good!!
I expect CADJPY to go Down after finishing the correction.
Look for your SELL setups.
Please follow me and like if you agree or this idea helps you out in your trading plan.
Disclaimer: This is just an idea. Please do your own analysis before opening a position. Always use SL & proper risk management.
Market can evolve anytime, hence, always do your analysis and learn trade management before following any idea.

CADJPY : Current Situation & Technical , Fundamental View#CADJPY
- CADJPY is currently selling after a STRUCTURE BREAK because the current MARKET SENTIMENT is NEUTRAL. Somehow, JPY is becoming somewhat STRONG. Similarly, the YEILD given by the BOJ to JP10Y increased, making the JPY STRONG. The reason for that is because the Bank of Japan did not intervene in the long term to strengthen the JPY, they are strengthening the JPY in other ways without raising the rate. Meanwhile, the price of OIL has gone down a bit, so the CAD has become very weak in the last few days. Anyway, as expected in the BOC RATE DECISION the other day, the RATE HIKE was done.
- But somehow the CANADIAN CENTRAL BANK has become HAWKISH. Therefore, CADJPY should definitely be slightly UP until the 103.110 LEVEL. Before that, there is definitely a very high possibility to sell to the 96.68 LEVEL. So FOLLOW STRUCTURES.

CADJPY : Current Situation & Technical , Fundamental View#CADJPY
- CADJPY is currently selling after a STRUCTURE BREAK because the current MARKET SENTIMENT is NEUTRAL. Somehow, JPY is becoming somewhat STRONG. Similarly, the YEILD given by the BOJ to JP10Y increased, making the JPY STRONG. The reason for that is because the Bank of Japan did not intervene in the long term to strengthen the JPY, they are strengthening the JPY in other ways without raising the rate. Meanwhile, the price of OIL has gone down a bit, so the CAD has become very weak in the last few days. Anyway, as expected in the BOC RATE DECISION the other day, the RATE HIKE was done.
- But somehow the CANADIAN CENTRAL BANK has become HAWKISH. Therefore, CADJPY should definitely be slightly UP until the 103.110 LEVEL. Before that, there is a very high possibility of selling to the 94.00 level. So FOLLOW STRUCTURES.

CADJPY : Current Situation & Technical , Fundamental View#CADJPY
- CADJPY is currently selling after a STRUCTURE BREAK because the current MARKET SENTIMENT is NEUTRAL. Somehow, JPY is becoming somewhat STRONG. And as expected, JPY WEAKNESS came after the BOJ INTERVENTION. This was because the Bank of Japan did not intervene in the long run to strengthen the JPY. Meanwhile, CAD has become very STRONG in the last few days due to the increase in OIL prices. Anyway, the RATE HIKE was not done as expected in the BOC RATE DECISION the other day. The rate hike was less than that.
- The price of OIL is going down very fast. For this reason, CAD will be slightly SELL.
- But somehow the CANADIAN CENTRAL BANK has become HAWKISH. Therefore, CADJPY should definitely be slightly UP until the 105.89 LEVEL. Before that, there is a very high possibility of selling to the 97.50 level. The reason for that is because even now OIL PRICES are going up a bit.

GBPJPY - FUNDAMENTALS WITH SECHNICAL BIAS#GBPJPY
- According to the GBPJPY analysis we gave the previous day, the GBPJPY SELL SIDE WAVE was moving very well in the previous days. The reason for that was, FUNDAMENTALLY JPY STRONG, GBP WEAK. And because the MARKET SENTIMENT is STRONG. XXXJPY has been selling very fast since last week.
- JPY has become somewhat WEAK because VIX is slightly DOWN. Due to this, STOCKS and XXXJPY CURRENCY were slightly BUY. GBPJPY also became BUY because of that. But now there is a RISK ON BIAS. Therefore, GJ can be BUY in the future.
- Currently GBPJPY LONG TERM can move up to the LEVEL 173.00. Also, according to the GBPJPY STRUCTURE, before BUY, you can go down to the SUPPORT LEVEL of 166.35 to the SUPPORT LEVEL.
Therefore, attention should be paid to MARKET UPDATES and MARKET SENTIMENT. A BOJ INTERVENTION MAY NOT HAPPEN AGAIN. Currently the MARKET is RISK ON. Therefore, XXXJPY should be BUY. Therefore, pay attention to the CURRENT MARKET SENTIMENT.

CADJPY : Current Situation & Technical , Fundamental View#CADJPY
- CADJPY is currently selling after a STRUCTURE BREAK because the current MARKET SENTIMENT is NEUTRAL. Somehow, JPY is becoming somewhat STRONG. And as expected, JPY WEAKNESS came after the BOJ INTERVENTION. This was because the Bank of Japan did not intervene in the long run to strengthen the JPY. Meanwhile, CAD has become very STRONG in the last few days due to the increase in OIL prices. Anyway, the RATE HIKE was not done as expected in the BOC RATE DECISION the other day. The rate hike was less than that.
- Currently, the price of OIL is rising very fast. For this reason, CAD should be a BUY in the future.
- Definitely CADJPY should be slightly UP until 108.500 LEVEL. Before that, there is a very high possibility that the 102.910 LEVEL will be sold. The reason for that is because even now OIL PRICES are going up a bit.

CADJPY : Current Situation & Technical , Fundamental View#CADJPY
- CADJPY is currently selling after a STRUCTURE BREAK because the current MARKET SENTIMENT is NEUTRAL. Somehow, JPY is becoming somewhat STRONG. And as expected, JPY WEAKNESS came after the BOJ INTERVENTION. This was because the Bank of Japan did not intervene in the long run to strengthen the JPY. Meanwhile, CAD has become very STRONG in the last few days due to the increase in OIL prices. Anyway, the RATE HIKE was not done as expected in the BOC RATE DECISION the other day. The rate hike was less than that.
- Currently, the price of OIL is rising very fast. For this reason, CAD should be a BUY in the future.
- Definitely CADJPY should be slightly UP until 108.500 LEVEL. Before that, there is a very high possibility of selling to the 105.00 level. The reason for that is because even now OIL PRICES are going up a bit.

CADJPY LONG with 4x price action reasons to buy. List of confluences:
1. Trendline breakout
2: Higher highs and Higher lows being created
3: Key level breakout
4: Several pin bars candles
CADJPY is currently in a strong uptrend when we look at the bigger picture trend so we will be only looking for buying opportunities. When looking at the daily chart
we can see that price has broken a recent counter trend line which signals the potential end of a pull back. This is followed by bullish market structure as price continues
to create higher highs and higher lows. We can also see a key level breakout and retest. This is further supported by several pin bar candles formed in the direction
of the bigger picture trend and around our areas of interest which include key level area, the trendline breakout and the most recent higher low.


CADJPY SPIKEprice is in an uptrend with structure confirmation. Waiting for price to pull back into retracement levels and give confirmation signals before committing to a long position

CADJPY : Current Situation & Technical , Fundamental View#CADJPY
Due to MARKET RISK OFF, CADJPY is going down a bit. We expect CADJPY to go UP again.
Either way, that price can retrace to the CADJPY MAIN TRENDLINE. After that you can go DOWNSIDE the MARKET. The reason for that may be due to the fall in OIL PRICES. You can definitely buy at the CADJPY 104.90 level. For that, MARKET RISK should be ON SHORT TERM.
But we can sell CADJPY up to 100.00 LEVEL according to the STRUCTURE. The reason for that is the idea that the MARKET SENTIMENT in the OVERALL MARKET will be RISK OFF in the coming days. We must pay attention to MARKET SENTIMENT.

CADJPY SELL with 3 confluences We will be looking to short CADJPY. The market has been bearish for several days. We can see signs of market exhaustion.
1. Trendline Breakout
2. Breakout Of Key Level
3. Retest of Key Level
Target is the low of the month. Risk Reward is around 1 to 8.

Trading Idea Regarding CADJPYAccording to my analysis this pair going bearish
Symmetrical triangle chart pattern on 4 hour time frame

Trading Idea Regarding CADJPYAccording to my analysis CADJPY is going Bearish For Upcoming Week
1- As it made W Shape Chart Pattern break above the Neck Line and go up.... Now Price is going to retest the neck line that has made on daily time frame
2- Price is making nice Quasimodo chart pattern on 4 Hour Time Frame also Suggest it Bearish behavior for the upcoming week
3- Price has break above from 200EMA its possible that it will retest the 200EMA after Breakout

CADJPY SHORTCADJPY is in the beginning of the bigger bearish impulse and therefore there are two areas where price may react or reject from the region, first one is 90.97 and the other is 91.20 lets wait and see, how price react at these areas.
