Cakeusd

🔥 CAKE / USD — PancakeSwap Trading 🔥 Breakout for x2!Today Cake breaking out from Bullish Wedge pattern. Right now price near $20 price level. It is better to use 20-18-16 zone to buy CAKEUSDT and take this setup.
My targets at 26-32-34-40-42-44. Long term possible 60-64.

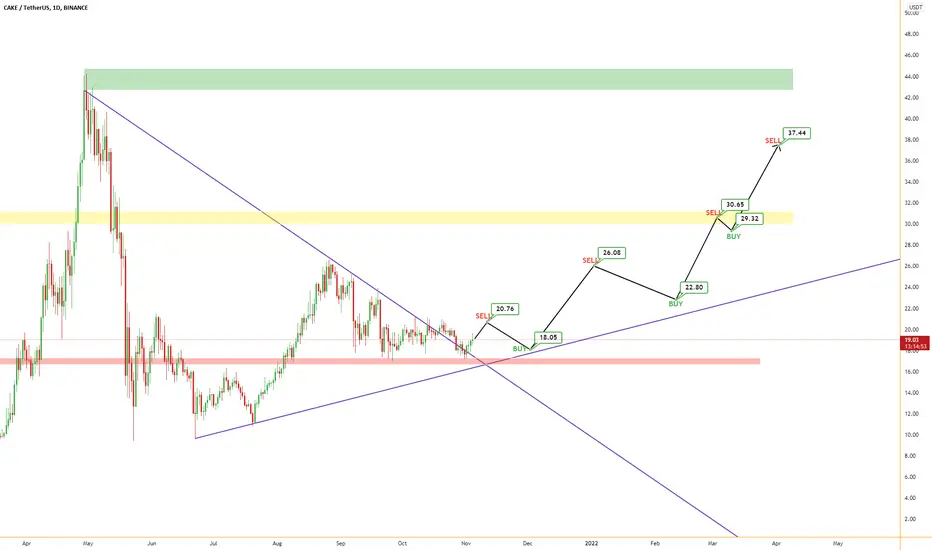
CAKEUSDT making a bullish breakout* Cake in Daily time frame appears with Descending triangle, with it's resistance as above trendline and the support zone around $17.
* Descending triangle is considered to be either trend continuation or trend reversal pattern depend on the breakout.
* If CAKEUSDT breaks it's above resistance, we can expect bullish momentum.
* Price is bearish below support.


Is the cake coming back?Given that BNB is so close to ATH , You can buy here cake for the specified targets if it breaks the trendline.

Short term Idea on CAKE LongFollowing a break of the trend and with a solid support and the strong fundamentals of most BSC platforms. We can expect a move up from here on Cake as well as other BSC platforms.

CAKE - Wait For The Trigger!Hello everyone, if you like the idea, do not forget to support with a like and follow.
CAKE is approaching a strong support and demand zone so we will be looking for buy setups on lower timeframes.
on H4: CAKE formed a wedge pattern but it is not ready to go yet. Before we buy, we want the bulls to take over.
Trigger => Waiting for a momentum candle close above the last high in gray to buy.
Meanwhile, until the buy is activated, CAKE would be overall bearish can still trade lower and dive inside the blue zone before going up. In this case, we will be looking for new buy setups to form.
Good luck!
All Strategies Are Good; If Managed Properly!
~Rich

Pancake break out Cake has been accumulating for some time, now it looks like it broke out of a symmetrical triangle towards the upside. The 200ma is the last resistance, then 0.5 fibonacci at 27$ then 31$ then 45$ then 53$. Moreover considering how well BNB is doing I am waiting for Cake to follow

CAKEUSDT - Trend Breakout!!CAKEUSDT (12h Chart) Technical analysis
CAKEUSDT (12h Chart) Currently trading at $19.45
Buy level :Above $19.75
Stop loss: Below $17
TP1: $21
TP2: $23
TP3: $26
TP4: $30
Max Leverage 3x
Always keep Stop loss
Follow Our Tradingview Account for More Technical Analysis Updates, | Like, Share and Comment Your thoughts.


CAKEUSDT ARE YOU RDY ?🧨🧨🧨It is a decentralized exchange for a year that their voice has risen in the crypto community.
All these exchange offices do their best to be able to have a good ranking in this group.
Pancake Exchange is one of these exchanges and can give a good profit to its shareholders, but we who are not shareholders are traders and in any case we get our profit from this currency code.
We are traders and all 😂😂😂
CAKE is ready to start its uptrend...It has broken its main trendline and I am going to buy some...
KUCOIN:CAKEUSDT
BINANCE:CAKEUSDT

$Cake to 30 $ USD?Cake has a build-up period of 65 days and a triangle has formed. Assuming bitcoin continues to rally up, the triangle is targeting $ 22, $ 26 and $ 30.
Otherwise, if cake falls below $ 16.90, the price action will take Cake to support the bullish channel at $ 15.
Take your forecasts, I am currently still doing cake staking

CakeAlmost touch fibo 60 and demand zone and other hand formed falling wedge !
In my prediction we will see bull run ...

✴️ CAKE/USDTCAKE has been trading in the yellow zone of the MMR band very severely, but on-chain data analysis shows the downward moves have started to come to an end. I expect CAKE to begin reclaiming its previous prices on the long time frame charts by retesting the resistances at 18.90, 21.00, and 22.60.

CAKEUSD LONGWeekly Demand Holding & OB created at daily Structure, Now price retesting OB to Move North and break those supply

CAKE/USDT ChartCAKE is in a very interesting position right now with a invalidation at the 17.50$ support and ready to a move to 21$ resistance. The RSI shows that the coin is undervalued, and the OBV is also seeing a good comeback. BNB has been pumping lately with a +5% move today, and we can expect a pump from other BSC coins (like CAKE). What do you think? Comment, like and follow.

CAKE; what to expect?CAKE will follow the bullish pattern of BNB soon enough. The next target is 23-26 areas but if bullish momentum continues it can easily reach around 36-42. Don't short this asset!

LongHello friends, the cake currency is suffering in a price box that does not have much time to leave the area. Consider the first goal as the box ceiling.

CAKE bullish or bearish? REVIEWSo I think it all depends on this support are around 18. It seems bears have the upper hand here BUT bulls are not so far behind either! AND with the recent BNB pump + fundamentals around memecoins which are mostly on BSC, I bet my money on the BULLISH scenario!
If somehow the bears takeover, which is very unlikely, the price can momentarily touch 16-13 areas that seems to have strong support. And even if this scenario plays out I still wouldn't be too worried about it as for the long term CAKE is definitely bullish AF!
HODL & stake for that APY!
(STILL, proceed with caution)
DYOR.

CAKE bullish or bearish?CAKE recently lost it's support at 20 and now it's retesting 18 zone.
I don't see any more price drop from here as this seems to be a very strong support zone. In the next few days CAKE will be retesting it's previous support zone at 20-21 and if it can break above it, which is likely according to bullish signs, price can easily target 26 resistance area and in extereme bullish scenario even 42 and higher but for that to happen I think we first need a more higher low support zone.

Cake price predictions- Bullish up to $100 in short to mid term- hitting long term support levels
- Total value locked seems to be rising- showing signs of reduced supply, currently 80%
- Hopefully expect price to reach ATH soon and maybe testing the $100 level short to mid term. Long term potential to $1000 but seems a bit far fetched considering market cap.
- On BSC Scan can see likely 20% remaining liquidity moslty all in exchanges, when this dries up further hopefully we'll see some nice price action to upside.
- currently great time to buy in around $18 to 20, and stake this on pancakeswap, and provide more upward thrust, NOT staking on the exchanges where they will take commission and reduce price potential as this commision will be added to selling pressure.
- TIP if you buy on the exchange, the exchange may try to block transfers off by saying issues with BSC, but essentially they don't want it going off their exchange, just be patient and remove it off the exchange, or transfer BUSD off exchange and buy directly on pancakeswap where you won't get these issues.

CAKE BULL RUNhi , our general opinion for cake is long in the longterm (when alt season begin),as you know in fib retracement between 0,786 and 0,618 zone is golden packet it means we should test it one day and our weakly strong support is 30$ and also 0,618 retracement is 30$ so our first target for cake is 30$ , second target is 44$ because its ATH . and as you see in the chart , cake make a descending chart pattern ( descending chart pattern in old market is a bearish but in new market like cryptocurrency is a bullish chart pattern) and it broke the pattern and our target based by pattern is 54,92$
