From Rejections to Breakout? CAKE Faces Key TrendlineNASDAQ:CAKE has been stuck in a long-term downtrend, constantly getting rejected from that falling red trendline.
But things are starting to shift...
After bouncing off the major support zone, price is once again pushing toward that trendline, and this time, momentum looks stronger.
If CAKE can break and hold above this level, we could finally see a powerful move toward the $5+ resistance zone.
Just a heads-up: it’s been rejected here before, so let the breakout confirm before getting too excited.
DYOR, NFA
Cakeusdt

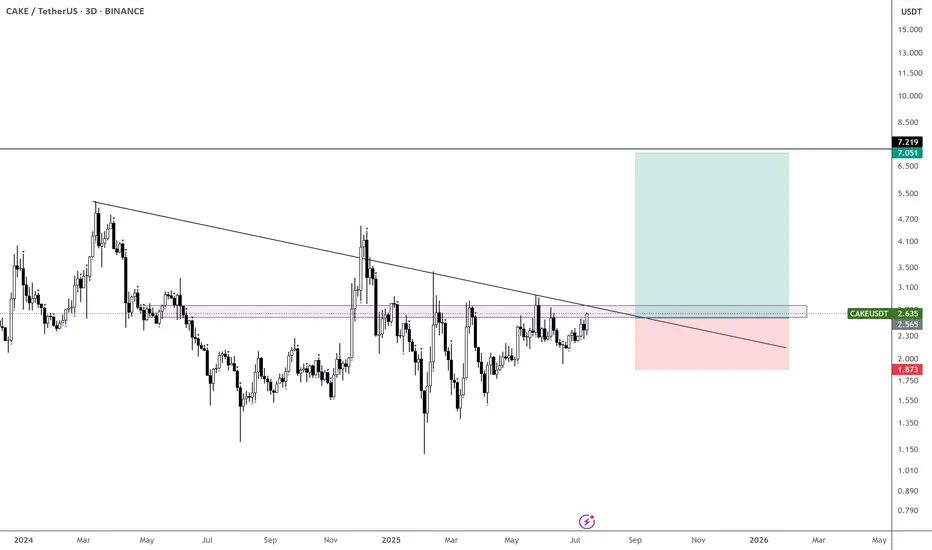
$CAKE is coiling up nicely - Aiming for $7
It hasn’t done much over the past few months, but it’s now above the yearly open and on its 6th attempt to break through the monthly supply zone.
Could this finally be the breakout that leads us toward $7?
Taking bids here and exercising patience.
With CRYPTOCAP:XRP , CRYPTOCAP:ETH , CRYPTOCAP:HBAR , and EURONEXT:ALGO already moving — and possibly CRYPTOCAP:BNB next — this could be a perfect setup for a delayed BINANCE:CAKEUSDT catch-up play.
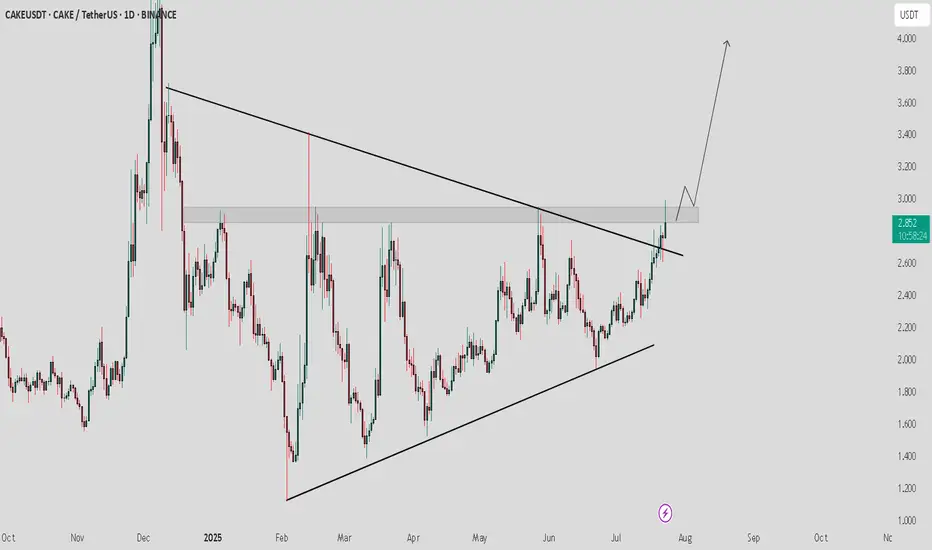
CAKE / USDT : Trying to break horizontal resistanceCAKE/USDT - Triangle Breakout
CAKE/USDT is currently breaking out of a triangle pattern after a period of consolidation. The price is now testing the key resistance area at $2.80. Once this resistance is cleared, we can expect a strong bullish move towards $3.50 - $4.00.
Bullish Scenario:
Break above the $2.80 resistance confirms the breakout, targeting $3.50 - $4.00.
Pro Tip:
Watch for volume confirmation to ensure the breakout is sustainable. Set stop losses below the breakout zone to manage risk.
CAKE/USDT Bullish Trend Continues? Heres My Trade Plan📊 CAKE/USDT Trade Setup Overview
Taking a closer look at CAKE/USDT, price action has been moving nicely with a strong bullish trend on the 4H chart — printing consistent higher highs and higher lows 🔼📈.
Right now, it’s looking a little overextended, and I’m eyeing a potential pullback into my optimal entry zone around the 50%–61.8% Fibonacci retracement level 🎯📉.
That’s my point of interest, but it's important to keep in mind that the pullback may either be shallow or extend deeper before stabilizing 🌀. The key for me is to wait for price to find support in that zone, followed by a bullish break in market structure on the lower timeframe (15m or 30m) 🧱✅ — that would be my signal to enter long.
This is not financial advice — always do your own analysis before trading. ⚠️

CAKEUSDT - Weekly Breakout Watch | End of the Bear Era?After enduring a brutal multi-year downtrend since 2021, CAKE/USDT is now showing clear signs of a possible major trend reversal. The weekly chart is forming an extremely compelling setup, with the price testing the upper edge of a long-term descending trendline, signaling a high-probability breakout scenario.
📉 Multi-Year Downtrend Nearing Its End
The yellow descending trendline drawn from the 2021 all-time high has served as a strong resistance for over 3 years.
Price is now trading just below the trendline, teasing a breakout.
A clean breakout above this structure would mark the transition from distribution to re-accumulation — a key signal for long-term bulls.
📈 Pattern Structure & Key Zones
Descending Triangle Breakout in progress: This classical pattern often indicates a major reversal, especially after a long period of consolidation.
Breakout Trigger Zone: 3.45 – 4.18 USDT
Validation Zone (Confirmation Resistance): 4.75 USDT
Mid-Term Target Zone: 10.04 – 12.84 USDT
Long-Term Targets (If momentum continues): 24.75 – 40.86 USDT
🟢 Bullish Scenario
If weekly candles close convincingly above the 3.45 – 4.18 USDT range:
A breakout confirmation would be in place.
Price could rally +200% to the 10 – 13 USDT region in the mid term.
If that resistance breaks, the next leg could reach 24 – 40 USDT, in line with previous cycle recovery structures.
Strong altcoin sentiment and volume spike would strengthen the bullish case.
---
🔴 Bearish Scenario
Failure to break and hold above the trendline could trigger a rejection.
Breakdown below 2.84 USDT would invalidate the breakout and shift structure back to consolidation or downside.
In a worst-case scenario, price could revisit 1.05 USDT, the all-time cycle low.
This bearish outcome could be catalyzed by macro volatility or Bitcoin correction.
📌 Key Support & Resistance Levels
Level Significance
1.05 USDT Macro Support (Cycle Low)
2.84 USDT Accumulation Support
3.45 USDT Breakout Trigger
4.18 – 4.75 USDT Confirmation & Retest Zone
10.04 – 12.84 USDT Mid-Term Target
24.75 – 40.86 USDT Major Resistance Zone
📊 Conclusion
CAKE/USDT is at a critical inflection point. A breakout from this long-standing weekly trendline could spark a powerful multi-month rally. The current setup resembles early-stage reversals seen in other altcoins prior to explosive moves.
If confirmed, this breakout might mark the beginning of a new bull cycle for CAKE — but traders should stay disciplined and monitor volume and price action closely to avoid potential traps.
#CAKEUSDT #CryptoBreakout #TrendlineBreakout #WeeklyChart #AltcoinSetup #TechnicalAnalysis #PancakeSwap #CryptoReversal #AltcoinSeason

CakePancake swap
Cake usdt Daily analysis
Time frame daily
Risk rewards ratio >3.3 👈👌
Target 4$
If cake can break the resistance on 2.9 $ it can move up to my target
If can't break it my analysis is failed and must try at the other time

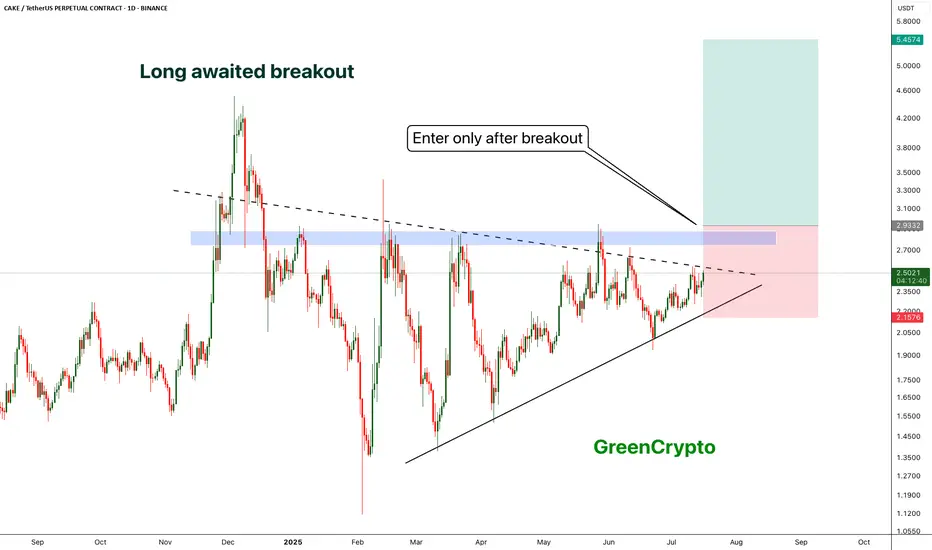
5$ is realistic target for CAKE- CAKE is trading inside the triangle since 2025
- now it seems like there is a possibility of breakout
- A clear breakout with decent volume would push the price towards 5$
- we will enter after the breakout
Entry Price: 2.9
Stop Loss: 2.15
TP1: 3.4371
TP2: 4.2671
TP3: 5.0083
Max Leverage 5x
Don't forget to keep stop loss
cheers
GreenCrypto
CAKE : Are we left behind?Hello friends🙌
😉We came with a good currency analysis from the decentralized exchange Pancake Swap.
So you see that we have a good price support that buyers supported the price well after each collision.
🔊Now, considering the collision with this support, we can expect growth to the specified areas. Of course, don't forget that capital management and risk are the priority of trading.
🔥Follow us for more signals🔥
*Trade safely with us*

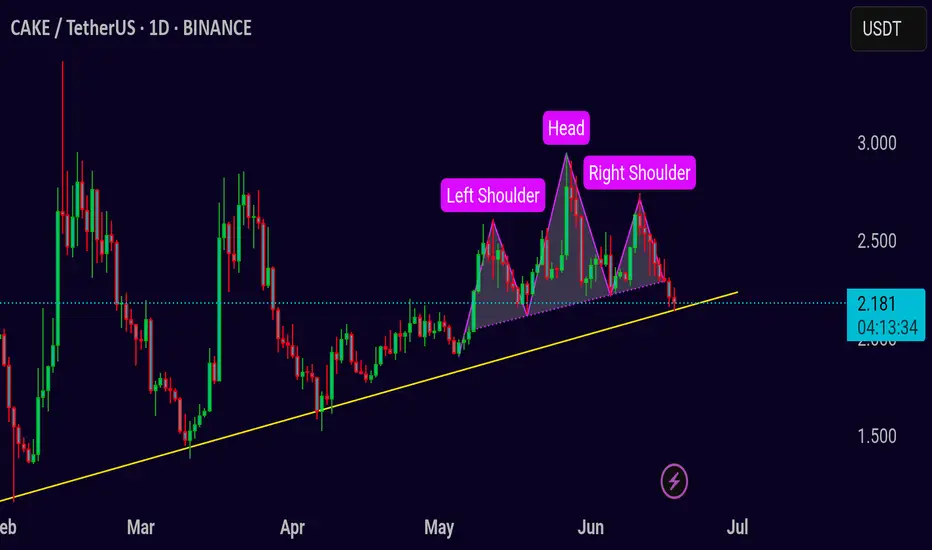
CAKE/USDT – Head & Shoulders Breakdown in Play Pair: CAKE/USDT 💱
Timeframe: 1D 📅
Pattern: Head and Shoulders Top 🧠
CAKE is developing a clear head and shoulders pattern on the daily chart, often seen as a bearish reversal setup. Price is currently testing the neckline support around 2.18, which also aligns with an ascending trendline. A breakdown here could trigger downside continuation.
Bearish scenario ❌
If CAKE closes below the neckline and trendline (under 2.15–2.10):
🎯 Target 1: 1.85
🎯 Target 2: 1.55
🛑 Stop loss: above 2.45 (right shoulder top)
Bullish reclaim ✅
If bulls defend the neckline and reclaim 2.35 with strong volume, the pattern may invalidate and lead to a rally.
⚠️ Volume confirmation is key — wait for a clean break and retest for confirmation.
#CAKE/USDT#CAKE
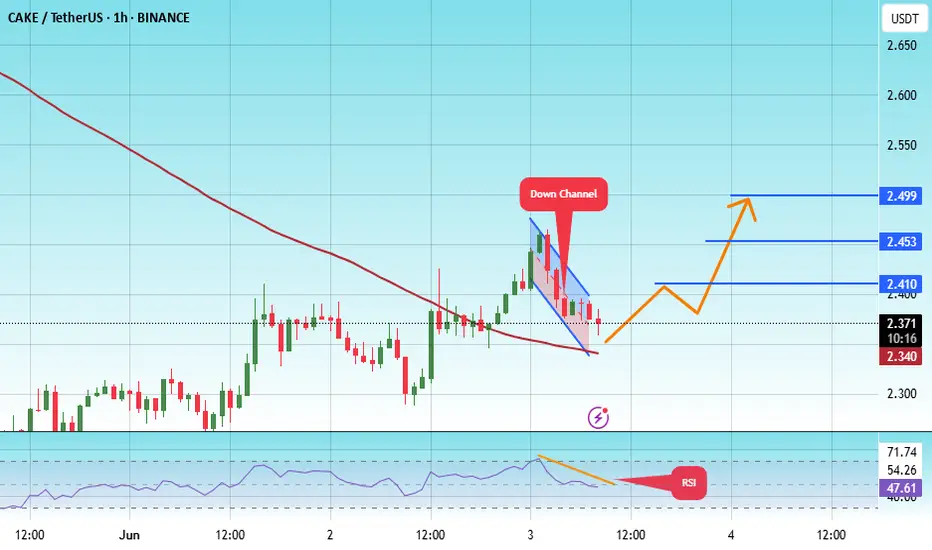
The price is moving within a descending channel on the 1-hour frame and is expected to break and continue upward.
We have a trend to stabilize above the 100 moving average once again.
We have a downtrend on the RSI indicator that supports the upward move with a breakout.
We have a support area at the lower limit of the channel at 2.29, acting as strong support from which the price can rebound.
Entry price: 2.30
First target: 2.35
Second target: 2.40
Third target: 2.46

#CAKE/USDT#CAKE
The price is moving within a descending channel on the 1-hour frame, adhering well to it, and is heading towards a strong breakout and retest.
We are experiencing a rebound from the lower boundary of the descending channel, which is support at 2.35.
We are experiencing a downtrend on the RSI indicator that is about to break and retest, supporting the upward trend.
We are heading towards stability above the 100 Moving Average.
Entry price: 2.38
First target: 2.41
Second target: 2.45
Third target: 2.50
#CAKE/USDT#CAKE
The price is moving within a descending channel on the 1-hour frame, adhering well to it, and is heading for a strong breakout and retest.
We are seeing a bounce from the lower boundary of the descending channel, which is support at 2.65.
We have a downtrend on the RSI indicator that is about to be broken and retested, supporting the upward trend.
We are looking for stability above the 100 Moving Average.
Entry price: 2.72
First target: 2.82
Second target: 2.92
Third target: 3.06

CAKE is flying in its skyCAKE is just started to fly. This is just a begin to its parabola. I need to tell again that if Bitcoin remains above 100k in the following weeks, a powerful fundamental news from Pancakeswap team will send CAKE price to the moon. Remember that the Pancakeswap version 4 is scheduled to be launched at 2025, Q3.
In my opinion, CAKE will be one of the pioneer and highly gained coins at the following altseassion. May be a life changing opportunity ...
-------------------------------------
Share and follow me for further updates.

CAKEUSDT | Green Zone Holding StrongCAKEUSDT has solid support around the green box levels. These zones have shown clean reactions in the past, and structure still favors buyers holding the line.
If price dips into that area again with low timeframe confirmation, it could offer a high-probability entry.
No hype, just structure and discipline.
📌I keep my charts clean and simple because I believe clarity leads to better decisions.
📌My approach is built on years of experience and a solid track record. I don’t claim to know it all but I’m confident in my ability to spot high-probability setups.
📌If you would like to learn how to use the heatmap, cumulative volume delta and volume footprint techniques that I use below to determine very accurate demand regions, you can send me a private message. I help anyone who wants it completely free of charge.
🔑I have a long list of my proven technique below:
🎯 ZENUSDT.P: Patience & Profitability | %230 Reaction from the Sniper Entry
🐶 DOGEUSDT.P: Next Move
🎨 RENDERUSDT.P: Opportunity of the Month
💎 ETHUSDT.P: Where to Retrace
🟢 BNBUSDT.P: Potential Surge
📊 BTC Dominance: Reaction Zone
🌊 WAVESUSDT.P: Demand Zone Potential
🟣 UNIUSDT.P: Long-Term Trade
🔵 XRPUSDT.P: Entry Zones
🔗 LINKUSDT.P: Follow The River
📈 BTCUSDT.P: Two Key Demand Zones
🟩 POLUSDT: Bullish Momentum
🌟 PENDLEUSDT.P: Where Opportunity Meets Precision
🔥 BTCUSDT.P: Liquidation of Highly Leveraged Longs
🌊 SOLUSDT.P: SOL's Dip - Your Opportunity
🐸 1000PEPEUSDT.P: Prime Bounce Zone Unlocked
🚀 ETHUSDT.P: Set to Explode - Don't Miss This Game Changer
🤖 IQUSDT: Smart Plan
⚡️ PONDUSDT: A Trade Not Taken Is Better Than a Losing One
💼 STMXUSDT: 2 Buying Areas
🐢 TURBOUSDT: Buy Zones and Buyer Presence
🌍 ICPUSDT.P: Massive Upside Potential | Check the Trade Update For Seeing Results
🟠 IDEXUSDT: Spot Buy Area | %26 Profit if You Trade with MSB
📌 USUALUSDT: Buyers Are Active + %70 Profit in Total
🌟 FORTHUSDT: Sniper Entry +%26 Reaction
🐳 QKCUSDT: Sniper Entry +%57 Reaction
📊 BTC.D: Retest of Key Area Highly Likely
📊 XNOUSDT %80 Reaction with a Simple Blue Box!
📊 BELUSDT Amazing %120 Reaction!
📊 Simple Red Box, Extraordinary Results
📊 TIAUSDT | Still No Buyers—Maintaining a Bearish Outlook
📊 OGNUSDT | One of Today’s Highest Volume Gainers – +32.44%
I stopped adding to the list because it's kinda tiring to add 5-10 charts in every move but you can check my profile and see that it goes on..

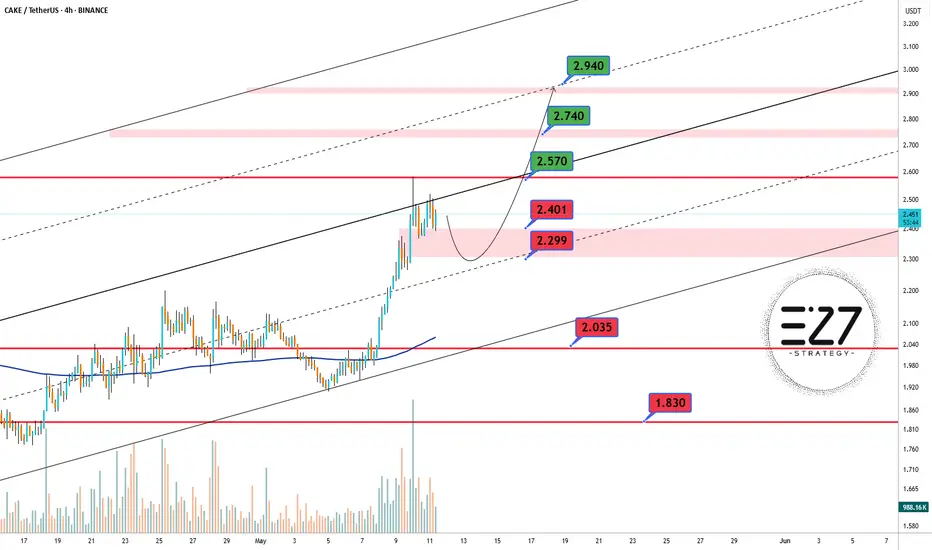
CAKEUSDT Pump📊 On the 4H BINANCE:CAKEUSDT chart, price has broken above the mid-term channel resistance and is currently pulling back. If the support zone holds, there’s potential for continuation toward higher resistance levels. A bullish reaction from the 2.299 USDT area could validate the next leg up.
🔄 If the correction deepens, the highlighted pink zone offers a strong re-entry opportunity. Key targets on the upside include 2.570, 2.740, and potentially 2.940 USDT if momentum continues.
✅ Key Support Levels:
🟥 2.401 USDT
🟥 2.299 USDT
🟥 2.035 USDT
🟥 1.830 USDT
🚫 Key Resistance Levels:
🟩 2.570 USDT
🟩 2.740 USDT
🟩 2.940 USDT
Pancakeswap: Slow Growth vs Fast Swings & Strong Shakeouts—1000%A prolonged rise is a strong bullish development. If a market takes 4 months slowly rising, this is nothing other than good. That's exactly what has been happening with CAKEUSDT.
It can be seen as no action or slow action or boring action, but this is the type of action that leads to a 300% bullish jump within a few short days.
Say from February through August 2025 Pancakeswap grows by 1,000%. Just an example. And consider the following scenarios:
1) CAKEUSDT goes sideways for five months and then grows 900% in the last month.
2) CAKEUSDT produces bullish consolidation growing slowly for three months, some 200-300% and then growths an additional 800-700% in the remaining three months.
3) Strong 300% growth in the first two months followed by a 2 months correction then a recovery and growth that totals 1,000% by August 2025.
These are very different scenarios, different roads that all lead to the same place. This can happen.
You can see a pair growing slowly and this is good as long as it isn't producing lower lows. It grows and grows and then some speed at the end, easy win. But, a pair can move lower and lower and then produce an equally strong bullish breakout and recovery and grow even faster than one that was producing bullish consolidation.
What I am leading to is this; patience is key.
It doesn't matter what happens in the short-term, there will be growth long-term. The way to win is to be in early and wait. Wait patiently because the market takes care of the rest.
There are no complexities in trading Cryptocurrencies you just buy and hold. Do not believe me? Do it now, buy now and wait until later this year and we will see what happens. If the market shakes, ignore.
I'll see you at the top.
Namaste.

CAKE retesting done. Ready to fly?As we discussed earlier, NASDAQ:CAKE retested the resistance line successfully. Now it is ready to fly. If Bitcoin remains above 100k in the following weeks, we look forward to powerful fundamental news from Pancakeswap team (e.g. launching Pancakeswap V4) to send NASDAQ:CAKE price to the moon. Fill your bags and get ready ...
-------------------------------------
Share and follow me for further updates.

TradeCityPro | CAKE: Triangle Squeeze Nears Breakout Decision👋 Welcome to TradeCity Pro!
In this analysis, I want to review the CAKE coin for you. This project is one of the crypto DEXs that operates on the BNB network and is among the most popular projects on that chain.
💫 This project’s token, CAKE, has a market cap of $747 million and ranks 95th on CoinMarketCap.
📅 Daily Timeframe
As you can see in the daily timeframe, a symmetrical triangle has formed, and the price is moving near the end of this triangle.
💥 Personally, I don’t trade when the price is in this area of the triangle and prefer to wait for the triangle to break, because there’s a high chance of random volatility that can cause missed opportunities due to incorrect entries.
✅ I recommend that you also wait for a breakout from this triangle and open a position only after it breaks—whether to the upside or downside.
✨ For a long position, you can enter after a breakout above 2.5. The main trigger will be the 2.847 zone. An RSI move into the Overbuy zone would also be a great confirmation for this position.
🔽 For a short position, our first trigger is the 1.909 level. If this level is broken, the price could start a downtrend toward 1.461. The main confirmation of a bearish trend will be a breakdown below 1.461.
📊 In any case, whichever trigger gets activated, I believe volume confirmation is essential. If volume increases along with price movement, the likelihood of that move being a fakeout decreases.
📝 Final Thoughts
This analysis reflects our opinions and is not financial advice.
Share your thoughts in the comments, and don’t forget to share this analysis with your friends! ❤️

CAKE is retestingAfter a successful breakout of triangle pattern from the top side, CAKE is now going to retest the resistance line.
So far so good.
Golden long is coming soon ...
-------------------------------------
Share and follow me for further analyses.

Pancake going downI am just leaving this here. We will see cheaper prices in the future before the real bull market begins. Looking for one last impulse to the downside. Once everyone is bearish we will see the bull market begin.

CAKEUSDT Potential UpsidesHey Traders, in today's trading session we are monitoring CAKEUSDT for a buying opportunity around 2.40 zone, CAKEUSDT is trading in an uptrend and currently is in a correction phase in which it is approaching the trend at 2.40 support and resistance area.
Trade safe, Joe.

Will $cake blove minds?The NASDAQ:CAKE , which is the official token of the most familiar decentralized exchange on BSC (Pancakeswap), is now broke the symmetric triangle on its USDT chart from the top side. Taking into account exciting fundamental news about launching Pancakeswap V4 in a couple of weeks, I think it will reach higher price levels.
My golden target level is: $6

CAKE/USDT | Rising Wedge ⇒ Supply-Zone ShortCAKE/USDT | Rising Wedge ⇒ Supply-Zone Short
Building on Prior Success
Following my May 1 CAKE/USDT forecast—view it here:
—which itself was rooted in the April 6 trend-rebound call that delivered a 38% gain:
📈 Market Structure
Pattern: Well-defined rising wedge since early April (blue trend-lines)
Bearish Impulse: Wedges often break down as buying exhausts into the apex
📌 Supply Order Block
Zone: 2.246 – 2.300 USDT (blue shaded area)
Upper Resistance: 2.387 USDT (Red line) marks April’s supply peak
⚔️ Entry Levels
Aggressive: Short on a clear rejection from 2.246 USDT (lower edge of block)
Conservative: Wait for a failed break or bearish candle near 2.300 USDT (block/wedge confluence)
🛑 Stop Loss
Invalidation: A close above 2.40 – USDT high-timeframe supply
Rationale: Allows for a false spike while protecting capital
🎯 Profit Targets
TP1 2.110
TP2 1.946
TP3 1.752
🔧 Trade Management
- Scale out partial positions at each TP to lock in gains
- Move stop to breakeven once TP1 is reached
- Reassess if price sustains above 2.40 USDT
⚠️ Rising wedges can whip both ways—always size positions properly and respect your stop.
