CALA Technical Analysis 🧙Calithera Biosciences Inc is a clinical-stage pharmaceutical company. The business activity of the firm is functioned through the region of US. It focuses on discovering and developing small molecule drugs directed against tumor and immune cell targets that control key metabolic pathways in the tumor microenvironment. Its lead product candidate is CB-839, an inhibitor of glutaminase for the treatment of solid tumors. Its other product candidate, CB-1158, is being developed for hematology and oncology indications.
If you want more trading ideas like this one ,🎯 press a thumb up! 👍 Have a question? Don't be shy to ask! 🤓 Interested to study how to analyze charts, follow me!
CALA
CALA Calithera Biosciences Inc is a clinical-stage pharmaceutical company. The business activity of the firm is functioned through the region of US. It focuses on discovering and developing small molecule drugs directed against tumor and immune cell targets that control key metabolic pathways in the tumor microenvironment. Its lead product candidate is CB-839, an inhibitor of glutaminase for the treatment of solid tumors. Its other product candidate, CB-1158, is being developed for hematology and oncology indications.
If you understand the idea,🎯 press a thumb up! 👍👍👍 Have a question? Don't be shy to ask! 🤓 Interested to study how to analyze charts, follow me!
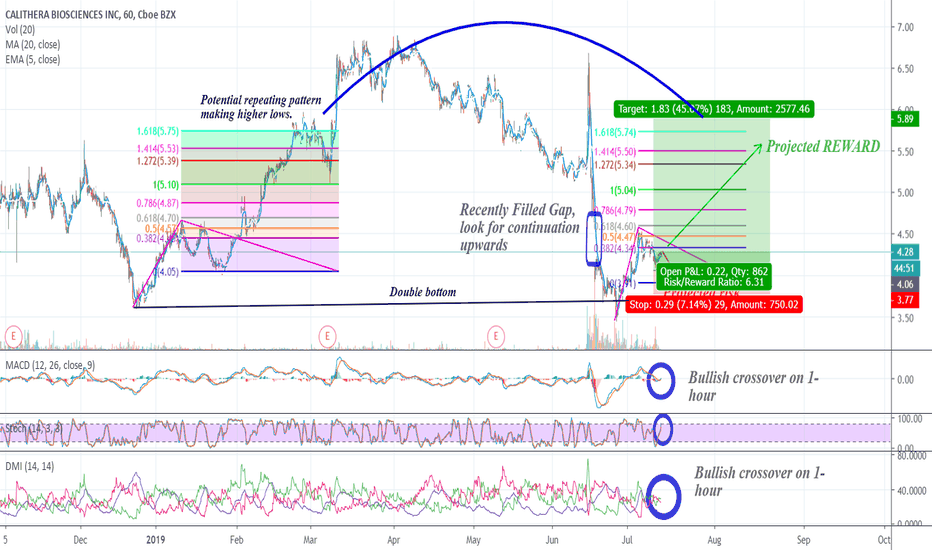
Cala #VolatilityWatchAfter a recent selloff in mid June 2019, Stock price went from from $6.70 down to $3.44. Cala looks to have established a double bottom. New strong uptrend suggests it has potentially capitulated from the selloff making these levels very attractive for any investors who are sidelined and looking for a good technical/ fundamental trade in biotech. Cala looks to be in the midst of a new uptrend.
June 2019 selloff marked double bottom for CALA.
This looks to be very attractive from risk vs reward standpoint (Assuming markets stay strong, I see approximately $0.40 downside vs $1.50 upside).
Extrapolating previous price patterns (shown in chart) Cala looks to be in the midst of 2nd wave (Bullish corrective wave).
the projection is based off previous price patterns where CALA retraced approximately .618 and extended above the 1.618 Fibonacci extension level.
trend indicators also signaling uptrend in play (see chart).
Tip # 9: Stop losses are a good way to get you out of a trade that you don't want to be in. But remember, they only work during market hours.
Please Like and Follow so I can continue giving trade ideas and build up my reputation. Thank you in advance =)
Have a Instagram or Twitter? follow me @VolatilityWatch
Disclosure : I do not own a position in Cala. I may buy/ sell within the next 72 hours. This is not a note to buy or sell. Please do your own homework before investing.
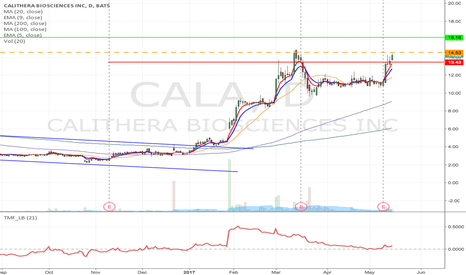
CALA- Flag formation Long from $14.53 to $16.18 and higher CALA was big performer, as we had a massive ride from $4 to $10 early this year. Now it seems flagging again. If it can break its resistance, it has potential to go higher.
* Trade Criteria *
Date First Found- May 15, 2017
Pattern/Why- Flag formation
Entry Target Criteria- Break of $14.53
Exit Target Criteria- $16.18
Stop Loss Criteria- $13.43
Please check back for Trade updates. (Note: Trade update is little delayed here.)
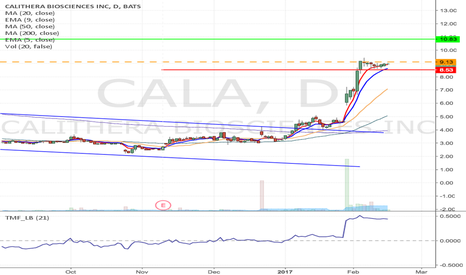
CALA - Flag formation Long from $9.13 to $10.83After a very successful Long trade, CALA seems getting ready for another upward move as it is forming another Flag formation.
If it can break recent high, it has good upside potential to go as high as $11 area.
* Trade Criteria *
Date first found- February 14, 2017
Pattern/Why- Flag formation
Entry Target Criteria- Break of $9.13
Exit Target Criteria- $10.83
Stop Loss Criteria- $8.53
Please check back for Trade updates. (Note: Trade update is little delayed here.)
CALA - Potential flag formation Long. CALA seems breaking out a downward channel, it also looks a potential flag pattern. However it is not fully ready yet, It has more work to do. We are keeping it in watch list for potential long.
CALA - Long from 3.40CALA looks a good long as it is forming a fallen-angel pattern , positive money flow divergence supporting for long trade. Break of 3.40 will be a good long entry, and our first target is 3.93 just around 385 fib. But it has the potential to go higher
"You can check our detailed analysis on CALA in the trading room/ Executive summery link here-
www.youtube.com
Time Span: 2:45"
Trade Status: Pending


