Bitcoin rising for one hour. Good for short trades.Okay so as you see the yellow dotted line. It's acting as a support and also as a resistance in the past. If we analyse the previous record we can see it is very easily broken and hence not a stable resistance or a support. So it gas 99% chances of breaking it and continue in the upward director for an hour or two.
CALL

PCC - Put call Ratio / Reliability has been a Solid Guide, accurate in the Extreme...
One exception remains the Higher end of the Range remains
open for a far Higher High.
Friday's Expiry was an excellent example of a PCC Squeeze
as rising from 1.1876 to 1.274 was an indication of Price having
a clear potential to run to close.
It did.
_________________________________________________________
Use it or lose it.
"Cheap" remains relative.

BEHOLD!!! GAINS FOR APES!!Hello everyone, I go by the name of Trexarch, or Chem..
Today I am here to display my newly drafted chart analysis for my all time favorite stock.
The analysis;
UP
That is all. Thank you.
Please check out all of my other posts related to GME to understand my full thesis.
Let’s wreck some teachers pensions, am I right boys? ;)
DRS DRS DRS DRS DRS DRS

PCC - Rnages into Squeeze ZoneObserve VIX today, it will provide the indications.
Globex squeeze for ES arrives on time again.
Make or break Week.
Only 1 time in market history did we see 7 weeks
of down.
_________________________________________
Bulls need a bunch today.
It's FUF.

$CHPT up 32% in the last 7 Days will we see profit taking? No doubt chargepoint is a great company and is cheaper than last year. BUT we are still in a bear market, can we see some profit taking or will we see it continue to trend up. I believe we will see some red and profit taking and will come down just a bit before another run.

PCC - Squeeze ZoneWorks every time.
Looking for an RT.
Use the PCC.
Quit guessing.
Don't be a chump.

Expected Key Points Amazon 12 May 2022Amazon 12 May 2022
The current implied volatility is at 56.8%/year
So that converted into daily is 3.58%
The close of yesterday was 2107
So based on that our channel for today is going to be compressed within
TOP 2182
BOT 2032
with a probability chance of 80.5% based on the last 3007 candles
From fundamental point, today we have
PPI and initial jobless claims releases and these mark a huge volatility moment
At the same time the current values are expected to be bearish.

Weekly Prediction 9-13 May QQQ Iron CondorQQQ
9 - 13 May
The weekly VXN-> Volatility Index for S&P 100 index / Nasdaq
Implied = 37.4
In this we have to standard it for weekly session
37.4 / sqrt(52-> 52 weeks in a year) = 5.19%
My historical product is telling me with 1.5x coficient that the expected movement for this week
E Volatility = 38.02 / sqrt(52) = 5.27%
With this data, from my calculations, when EV > VIX, there were a 86.6% chance that the market
stay within the bottom and top created with the ranged from the E Vol
So for next week this range for us is going to be
TOP - 325.5
BOT - 293
Lets look into an iron condor oppotunity for trading:
325Call Sell - 328Call Buy
293Put sell - 290 Put buy
This is giving us at the current moment a 0.35 expectancy
So taking into account from 1109 weekly candles, that 86.6% of the times the market stay within our top/bot channel,
Our profit margin would be 86.4% * 0.35 - 13.6%*1 = 16.9ROI after 100 trades

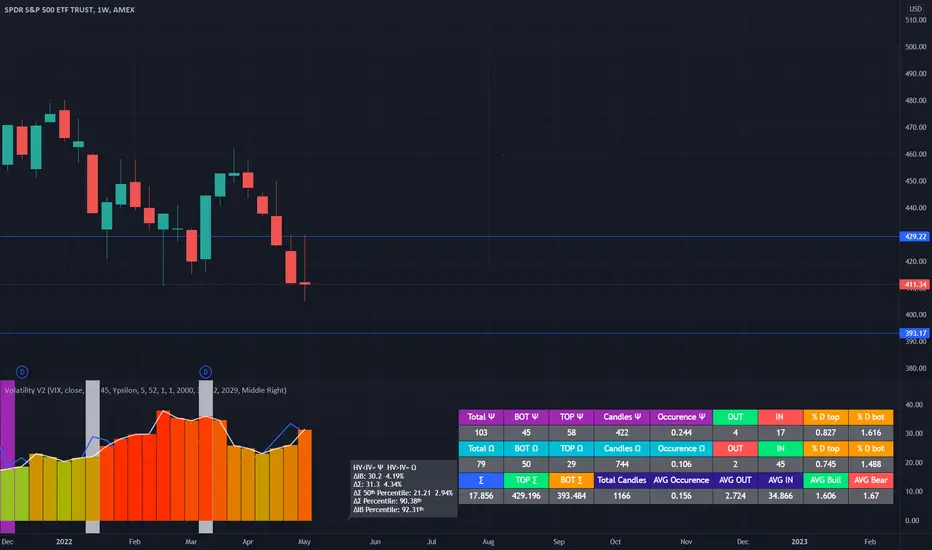
Weekly Prediction 9-13 May SPY Iron CondorSPY
9 - 13 May
The weekly VIX -> Volatility Index for S&P 500 index
VIX = 30.2
In this we have to standard it for weekly session
30.2 / sqrt(52-> 52 weeks in a year) = 4.19%
My historical product is telling me with 1.5x coficient that the expected movement for this week
E Volatility = 31.3 / sqrt(52) = 4.34%
With this data, from my calculations, when EV > VIX, there were a 90% chance that the market
stay within the bottom and top created with the ranged from the E Vol
So for next week this range for us is going to be
TOP - 429
BOT - 394
Lets look into an iron condor oppotunity for trading:
429Call Sell - 432Call Buy
394Put sell - 391 Put buy
This is giving us at the current moment a 0.32 expectancy
So taking into account from 1166 weekly candles, that 89% of the times the market stay within our top/bot channel,
Our profit margin would be 89.4% * 0.32 - 10.6%*1 = 18.6ROI after 100 trades
Weekly Prediction 9-13 May SPX/ES Iron CondorSPX
9 - 13 May
The weekly VIX -> Volatility Index for S&P 500 index
VIX = 30.2
In this we have to standard it for weekly session
30.2 / sqrt(52-> 52 weeks in a year) = 4.19%
My historical product is telling me with 1.5x coficient that the expected movement for this week
E Volatility = 31.69 / sqrt(52) = 4.39%
With this data, from my calculations, when EV > VIX, there were a 89% chance that the market
stay within the bottom and top created with the ranged from the E Vol
So for next week this range for us is going to be
TOP - 4305
BOT - 3942
Lets look into an iron condor oppotunity for trading:
4300Call Sell - 4325Call Buy
3950Put sell - 3925 Put buy
This is giving us at the current moment a 0.29 expectancy
So taking into account from 1166 weekly candles, that 89% of the times the market stay within our top/bot channel,
Our profit margin would be 89% * 0.29 - 11%*1 = 14.81 ROI after 100 trades

PCC - Tom Lee JinxNever underestimate the lunacy of former JPM Alumni
Tom Lee.
The Cathy Wood of C N B C - Tom simply needs to STFU.
In January, Tom was concerned about the Markets after
Mid-Year...
________________________________________________
Market Liquidity is evaporating.
Volatility is expanding.
The Algos have been very careful to press the Sellers on
spikes in the Put/Call Ratio for the CBOE.
_________________________________________________
Real Estate Ballon
Stock Market Bubble
Bond Market Beyond
So, VX intraday is used to keep everyone offsides and out
of the trades with extreme - wide-ranging swings.
Use the PCC to your advantage, it has worked quite well.
The range has been roughly 105 to 135 recently.
Trade safe and good luck.

Put Call - PCCCall buying is needed for the Gamma Squeeze.
Same junk, different month, same trade.
Kick em when they're up, kick when they're down.
_____________________________________________
Laundromat Thursday.

Short and Long Iron Condor SPX 05 May 2022We can estimate with a 84% confidence that the volatility for today is going to be below 1.65%
For this the market will stay within
TOP 4371
BOT 4230
At the same time We can estimate with a 86% confidence that the volatility for today is going move more than
0.4% based on the last 5658 Daily candles.
For this the market will stay above the
TOP 4306
BOT 4272
From the fundamental point of view, yesterday we had the release of the interest rates, so I believe currently
we are in a short relief moment, where we can have for some days/weeks a small bull trend
For today we have no big volatility news, so we cant expect big surprises.
From volume point, we can see that the point of concentration is around 4300-4285
Having said that we have 2 different ways of trading for today
IRON CONDOR for the first option, with the 4370sell 4400buy Call / 4230sell 4200buy Put
Reverse IRON CONDOR for the second option wiht 4305buy 4330sell Call/ 4275buy 4250sell PUT


Put / Call Ratio CBOEPCC can become more extreme, will it...
The one to watch for a Countertrend.
Many Sectors have broken or are @ 200 EMMs.
________________________________________
Many Weekly candles shower an acceleration of
Momentum last week.
Eventually, the squeeze arrives... from where...
TBD.

DOA trading Strategy - SPY#SPY - Update, we are currently bouncing at HL
If we hold here we'll see $445 by May 16, 2022

TWITTER do not fight ELON Call $65 strike June 17Twitter will reach ATH in 2022. Elon knows how to create value in a company beyond what our human brains can comprehend

NVIDIA call options strike price $325 July 17Thank you for the dip, people buy Nvidia chip cards for 2X MSRP. I want exposure to this company, YES PLEASE

Ascending Triangle in the XLEThe Macro trends of 2022 are no secret to any of us. Sky rocketing inflation and the war in Ukraine have lead to soaring energy costs around the world. As a result, Oil has seen a period of extreme volatility, reaching a high of closing high price of 129.44 on March 8th. As a result, the XLE has followed suit and is up about +30% year to date. Exxon, the largest holding in the XLE, reports earnings on April 29th and has expressed that the anticipate setting record profits. Buy the rumor?
The XLE appears to be forming a nice Ascending Triangle, which could be suggesting a bullish continuation. The Ascending Triangle isn't a particularly strong pattern from a statistical perspective with only about a 60% chance of realizing the bullish continuation. Take it with a big grain of salt, but there is also a very slight Hidden Bullish Divergence on the MACD. Nevertheless, it warrants paying attention to as a potential swing trade.
A lot will depend on what Oil does, and the fact that XOM and CVX are reporting earnings on the 29th muddies the waters a bit. However, it could offer a nice opportunity for a shot in the dark trade to the upside looking for a pop the upside in advance of the earnings. Maybe something like an OTM Call spread around the .30 delta in XLE 30 days out or so...

Buckle Up ButtercupI have been following GME forever. I have even gone to that little movie that was created to show my dedication. I have GameStop merchandise and clothing. I love this company.
Lately things have been feeling different than usual, I still expect time to do its duty, as well as catalysts to potentially increase our duration at these levels as well.
Soon however, GME will be more than a stock.
Soon I expect large green bars.
Soon.
Buy. Hold. DRS.
Want a choccy milky from the gas station to fill ur tum tum with num nums?! NO!!!!
Because save $$ -> BUY -> HOLD -> DRS
I LOVE YOU ALL
GOODNIGHT
(NFA)

BTC NEXT TARGET AND BEAR MARKET UPDATE 24/03/2022First post update: $ 33,000 threshold $ 35,000 is the largest support ever created. If I'm wrong, don't judge me, I just want to have a big party on a yacht listening to Danza Kuduro :)

Analysis on USDJPYHello, my fellow traders hope you all are making some profits. We are here with our new analysis so that we can increase those profits for you. Let’s get into it.
As we can see, the price is at its STRONGE TRENDLINE RESISTANCE. I am expecting a reversal.
Let us know your views on this in the comment section. Thank you all.
There is good news for our followers. We will be analyzing on-demand.
So let us know which pair you want our analysis on, and we will get it for you. Do like and follow us

Eve & Adam Double Bottom confirmation on Costco ($COST)Earlier this month, Costco made confirmation of an Eve & Adam Double Bottom chart pattern as it began seeing daily closes above the mid range between lows. This pattern indicates a fairly high probability (about 88%) of a bullish reversal relative to the sell off which from the recent all-time high (571.49) achieved on December 29th, 2021.
Today, the price is within 10 points of the all-time high. I'll be looking over the coming weeks to see what happens next, and for possible positions. From here, I see one of two likely outcomes over the near term:
A) COST breaks out above the previous high and likely has a forcible move to the upside, or...
B) COST gets rejected from the current levels in the near term and has a pullback to somewhere around $520
In the case of A , I'll be looking to short either with a PUT spread, or potentially straight up long PUTs - which have a greater risk/reward but are enticing considering the macro picture of the broader market/economy as a whole. In the case of B , I'd shop for a long position with some kind of CALL spread.
The statistics indicate that track B has about a 2/3 chance of playing out. This could be even more advantageous because it could potentially offer both decent long and short opportunities over the next few months. We'll have to see where the chips fall.
