Trade Log NIFTY May 15About my trades today
I made two trades today.
1. NIFTY formed initial red candle taking it below 9130. I shorted 9300 CALL on retest and squared on first sign of weakness.
2. Since NIFTY was not breaking 9050 , last low, I took reversal trade and squared it off before EOD on first spurt.
Overall, I followed the plan and price action and it was not a crazy day!
Yesterday I had said ,
1. NIFTY is again in the lower bound of the range, It is likely to go below 9130 and then down to earlier lows around 8800.
2. This fall may not be steep or with momentum. It can be another range bound movement in 9350 - 8800 area.
Point 1 turned to be true today. The second point , I have to see. But the selling was definitely lacking momentum.
I observe the following points about today's market action
1. NIFTY did not break the last low of 9050.
2. The close was just on the important support line of 9130.
3. VIX fell little -0.43%
4. Advance Decline is 23 to 27, neutral.
5. NIFTY reversed but could not close/touch above high of the day.
Overall I think next week in news driven week, and if there is no news NIFTY is likely to continue towards 8800 in slow fashion.
I shall do a detailed weekly update over the weekend!
CALL

Trade Log NIFTY May 14About Trades today:
1. I sold 9600 CALLS intended to expire. Since market opened gap down, I did not sell PUTS.
2. Opening range of 15 Mins was broken , but could not sustain, hence I enetred the trade sell 9300 CALL intended to covered on touch other end of the range.
3. On touch of range , 9200 PUT of next week expiry was entered , but it was lacking strength, and sold before 1.30
4. When the range broke down, I sold 9200 CALL of next week expiry and closed the position around EOD.
In my notes yesterday
I had said,
1. Somewhere market players are doing the maths and estimating that the impact of stimulus in the short term is minimal. Otherwise the range breakout would have been sustained.
2. The series of FM conferences will create some sector specific action, but overall stimulus bounce is behind us.
3. Since we are on the top bound of the range, the obvious bias is to again short till we breakout the range, that is close above 9450.
It turned out to be true. NIFTY actually swung back near to the other end of the range.
I have the following observations about today's price action
1. NIFTY gap down near support area 9200, but after initial bounce, it did not show any buying.
2. VIX fell 1.68%
3. Advance Decline ratio is very weak 40:10
4. BANK NIFTY under performed . It fell -2.88%. It also just filled the gap, did not fell further like NIFTY, so overall, it has better performance if we combine yesterdays move.
5. Tech sector weakened today based on US news flow.
All this means
1. NIFTY is again in the lower bound of the range, It is likely to go below 9130 and then down to earlier lows around 8800.
2. This fall may not be steep or with momentum. It can be another range bound movement in 9350 - 8800 area.


EURNZD Short opportunityHi guys, here is another trade I've just launched !
On FOREXCOM:EURNZD we have a clear short as we've hit a really strong resistance.
TRIX is negative on H4, and just turned out to be negative in daily so it indicates we should sell ! It's just about time it turns negative in H1
Tell me what you think ?


Trade Log NIFTY May 12About trades today.
I sold 9300 CALL as there was a gap down opening below 9190. I squared off the position when NIFTY could not go below 9040.
I sold 9000 PUT as there was a possibility of bounce. I squared off this position in profit.
I hold 9500 CALL sold from Friday. That position is open.
NIFTY Opened gap down below 9190 and continued till 9050. Then it reversed sharply to close near 9200. This may be the lower bound of the range - 9050.
I have the following observations about today's price action
1. NIFTY opened gap down and closed the gap. Also today was 7th down day.
2. NIFTY bounced off sharply from 9050 level. If NIFTY manages to close above 9340 in next two days, NIFTY may again try to touch upper bound of the range.
3. VIX rose less than a percent.
5. Advance Decline ratio 32:18 , on positive side.
5. BANK Nifty performed similar to NIFTY.
I read this action as
1. NIFTY has touched the 9050 region and reversed. It may now try to retrace and go towards 9440, upper bound. This may be successful or not.
2. From overall price action today, buying the dip in NIFTY or BANK NIFTY would be good strategy for coming days.

Trade Log NIFTY May 11About trades today.
I sold 9300 PUT as there was a gap up opening above 9350. This position is trapped. I squared off the position for loss.
I also squared off my positions from Friday.
I hold 9500 CALL. That position is open.
NIFTY Opened gap up above 9350 and sustained there for some time, like 30 minutes. But then it was straight down day. So 9340-9440 is a hard to break resistance zone.
I have the following observations about today's price action
1. NIFTY has opened gap up and closed the gap. This has happened 3rd time in last 5 days.
2. NIFTY showed follow through on the downside after breaking below 9350.
3. VIX fell little less than a percent.
5. Advance Decline ratio 30:20 , on positive side.
5. BANK Nifty fell down 2%, mostly due to ICICI Bank
I read this action as
1. I assume now some momentum is gathered. If NIFTY breaks below 9130, this fall will touch 9000 region.

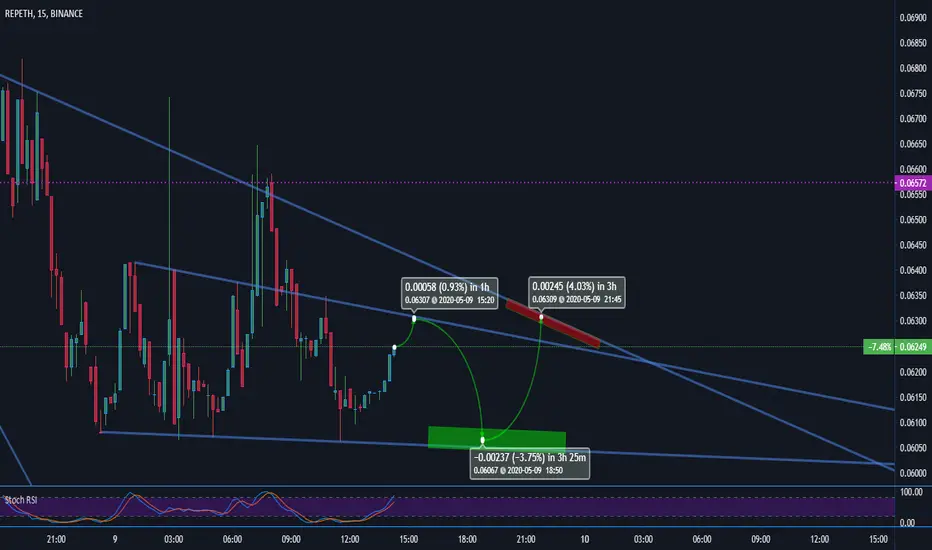
$REP/ETH | 4% Day ScalpEASY LOOT | Estimated Time: 6 Hours
ETH/REP | Small Account Trade | Target Gain 4%
Entry: .06077
Exit: .06327
Stop: .05997
Do not trade this. I am personally trading this.


Trade Log NIFTY May 8About trades today.
I sold 9200 PUT as there was a gap up opening. This position is trapped. I bought 9000 PUT to reduce overnight risk.
I also sold 9600 CALL as NIFTY crossed 9330 below. Booked Profit in that position.
I sold 9500 CALL when NIFTY crossed below 9300. That position is open.
In my May 6 Log
I had said
1. I think NIFTY may open gap down or little negative and move towards 9000.
2. Until we close above 9300, it is better to stay on short side.
3. Gap up opening is possible only when there is some positive global news. In that case, need to wait for close above 9350.
Review : NIFTY did not gap down, instead gap up. But it did not sustain over 9350. It did not close above 9300.
I have the following observations about today's price action
1. With Morning gap up, range was broken, but it turned out to be false breakout of 9350.
2. NIFTY consolidated in the tight range of 9300 and 9330 for morning hours and finally broke down below 9300.
3. In sell off below 9300, there was no momentum. Many bars are overlapping and with tails.
4. VIX fell little 3.81%
5. Advance Decline ratio 28:22 , neutral.
5. BANK Nifty fell down more and closed in negative, -0.7%
I read this action as
1. Trend is negative but momentum is lacking on downside. Considering uncertainty, this may continue going forward for some time.
2. Sometime soon, NIFTY will try to touch other boundary of the range , that is 9130,
I'll do a detailed post for weekly review for the week over the weekend.

Short term buy signal. BTC buy below 9200.This is short term buy call. put SL 8960 at 20days EMA Halving is testing my patience. lol.
Give a like, it’s absolutely free to appreciate anyone. Happy life. take care.

Trade Log NIFTY May 7
In my yesterday's market review, I had said
1. Tomorrow is expiry day. I wont take tomorrows action, especially sharp move if any as indication of further trend.
2. Mostly indecisive day today, so we have to see in which direction the NIFTY moves further. I do not have any bias going in tomorrow.
3. But if I have to build some view, then I think it'll be uneventful expiry (9300 +- 50) tomorrow, if there is no news flow tonight.
Point 3, around uneventful expiry turned to be correct. The expiry happened around 9200 with lot of chopping moves.
I have the following observations about today's price action
1. Market was very choppy and formed indecisive candle, which is inside candle as well.
2. The action around 9200 -9230, It was a narrow range action - no trade possible.
3. Bank NIFTY also traded in very narrow range.
4. Breadth was bad. 11 Advances and 29 declines.
4. Option writers again going in with 9000 as lower limit and then 9300 upwards calls were written.
All this means
1. Trend is negative. and market paused today.
2. Sometime soon, may be tomorrow, there will be expansion of the range. On downside till 9000. And for upside, first NIFTY needs to build above 9350.
For tomorrow,
1. I think NIFTY may open gap down or little negative and move towards 9000.
2. Until we close above 9300, it is better to stay on short side.
3. Gap up opening is possible only when there is some positive global news. In that case, need to wait for close above 9350.

Trade Log NIFTY May 5
In my yesterdays review, I made the following points
1. This fall now wont be as unidirectional and steep as the March fall.
2. There will be choppiness with negative bias.
3. 8300 is not short term bottom.
4. The first bounce if any tomorrow will likely to fail.
Point 3 and 4 were confirmed by today's price action.
I have the following observations about today's price action
1. VIX did not dropped significantly. This means this continuation did not surprise or created fear.
2. The sell off after 1.30 was steep. And there is no climax action today.
3. Bank NIFTY under performed severely. 4. Breadth was not too bad considering the points lost, but banks contributed to the losses.
4. Option writers consider 9400 -9500 unbreakable by May 7.
All this means
1. Trend is confirmed as negative.
2. This drop in now entering the choppiness zone of last rise, 9000 - 9150, This is likely to offer first support if any.
For tomorrow,
1. Today NIFTY did opened with positive global clues but could not sustain. I expect some gap down opening if there are even mildly negative news.
2. I do not have clear idea, but my hunch is tomorrow again will be a down day with mostly some support discovery around 9050-9150 region.

Trade Log NIFTY May 4NIFTY opened large gap down and trended down with no major pullback.
1. VIX shot up 28%
2. Bank NIFTY under performed.
3. Broke below last important support area of 9400.
4. Also broke the support line of rising wedge.
6. Breadth was highly negative 424 Advances : 1399 Declines.
All this indicates the following
1. Trend is changed to negative,
2. This is definitely second leg of the fall that started in Feb-March.
But looking at the conditions , news flow etc
1. This fall now wont be as unidirectional and steep as the March fall.
2. There will be choppiness with negative bias.
3. 8300 is not short term bottom.
4. The first bounce if any tomorrow will likely to fail.
I made small intra-day trade today for profit. I have also created Credit Spread for this week between 9300 - 9100. Because I think NIFTY will have some consolidation over 9000.


EURUSD ANALYSIS DAILY CHARTSo last week was a reversal, monthly close also, that's why every analysis posted last sunday was wrong, we see now a clear weekly engulfing candles, we wait the retracement causing by the daily resistance
