SHORT ON EA COMING SOON GUYS!!!EUR/AUD.
Prices have exceeded our target profits, if you managed to hold your position on this trade to our current highs, well done!
I truly believe that it's now time to go short on this pair now, currently prices are below the 1.62000 Region . I believe that if prices break above this region we could possibly be heading much higher.
HOWEVER, if our resistance zone the 1.62000 Region is respected, we could be heading to the downside target of 1.58000 Region.
Is this probable?
Yes! I am prepared to get in on this trade around the 1.61000 Region down to 1.58000/1.56000.
Let's wait and see, updates are coming very soon!
STAY TUNED!
CALL

TARGET ACHIEVED ON EA!!!TARGET ACHIEVED!!!
Well guys we achieved our Target Profit!
So we smashed through our TP's!
Congratulations if you banked pips on this trade, stay tuned guys!
This trade isn't done yet guys!
We might have a short coming very soon on this pair, I'll keep you guys updated!

EUR/JPY GOING LONG!LONG ON EUR/JPY?
I anticipate a rise in prices to the upside target of the 134.00 Region.
TP: 132.00/134.00

COULD TRON GO UP TO $10? (LONG TERM)Could Tron go up to highs of $10?
Let's wait and see guys, I truly believe that we could see highs $10.
Perhaps $15.
Let's Wait And See!

CORN GOING LONG?I'm anticipating corn prices to ascend to highs of $5 in the next couple of weeks guys.
Break of this trend line should give the green light for all the bulls!
I am however expecting a kiss on the trend line accompanied by a sharp reversal to the upside target of $5.
I'll give updates on this idea!
TP: $5 [ /i]

OMISE GO! OVER 500% GAIN ON INVESTMENT GUYS!OmiseGo HEADED TOWARDS $28!
Guy's we are going for the long run here!
We've got prices currently headed towards our support zone at $5.
Prices could of course bounce off of our current support zone or penetrate this to go even lower, preferably prices head lower towards the $4/$2 Region however this is incredibly idealistic to say the very least.
Let's Wait And See Guys!
TP: 28.00

NETFLIX HAS BEEN PHENOMENAL, LET'S GO LONG AGAIN!So we may have an opportunity to go LONG once again on NETFLIX.
So as you can see, we're currently in between both our support and resistance region, I believe that we could potential retrace down to lows of 280.00 and shoot back up.
HOWEVER.
Something tells me that we're currently heading to the upside with full intent of penetrating our resistance zone. It wouldn't do any harm getting in at this point, our targets 360.00 & 380.00
TP: 360.00 & 380.00

BUY ON FACEBOOK! REVERSAL COMING FAST! (GOING LONG)I was looking at Facebook for a while now, I did anticipate a strong sell off down to our key level in red , a bounce was expected however prices could of penetrated the 160.00 Zone down to lows 145.00 . Prices are currently getting ready to travel to the upside of 180.00 Region . This move is fuelled by aggressive buying, have a look at your volume on this stock guys!
TP: 180.00/184.00

US Wall Street.CAN WE GO LONG?CAN WE GO LONG ON US Wall Street?
Alright, so prices currently above our current support zone at 24500.0.
We could potentially break to the upside, penetrating our bearish trend line with the potential of reaching the 26000.0 Region .
Is This Probable?
Let's wait and see!

LONG ON GOLD?COULD GOLD PRICES VIOLATE OUR RESISTANCE ZONE?
I think that a bullish movement on this metal is in the works, we could see GOLD appreciate to highs of 1350.0. ULTIMATELY eliminating our current resistance zone , and smashing through our ceiling at the 1360.00 Region!
Lets wait and see!

LONG ON NIKKEII believe that we've got a real chance to go long on this trade, we could see appreciation up to highs of 23400.00. I'm waiting for a strong break on my trend line accompanied with convincing volume. Expecting some turbulence around the 22400.00 Region.
TP: 22400.00

LONG ON GU!GBP/USD.
I think that we've got some real bullish opportunity on the table here guys, I'm anticipating this pair to fly to highs of 1.42000/1.43000 .
This pair could potentially kiss the trendline, and surge upwards taking out our current high near 1.40000, or we could just see a massive surge in prices up to our expected TP.
TP: 1.42000 & 1.43000 .

LONG ON GERMANY 30!Going long on Germany 30 up to highs of 13000.00/13200.00/13400.00 . This might be a rough ride to our targets, you guys might want to enter this trade before prices exceed our resistance( 12600.00 ).
Lets Go!

EUR/USD GETTING INTO BULLISH STRIDE?LONG ON EUR/USD?
I believe that prices could potentially rise up to highs of 1.25500/1.26000.
Probable Triple Top?
I don't think so, of course I can't say for a fact that prices will reach to highs of 1.26000. As prices have respected it's current resistance zone twice , and will most probably do the same on third attempt .
Let the markets do the work, expect two things extreme turbulence at the resistance zone or aggressive buying penetrating through the 1.25500 Region!
TP: 1.25500/1.26000

GBP/CHF LONGLONG ON GBP/CHF!
So I'm currently expecting a bullish breakout on this descending trend line, up to highs of 1.31500/1.32500.
Some turbulence is expected, as this might be a very rough ride, prices could ultimately kiss the trend line and breakout or could breakout to come back into normal range which is of course very frustrating.
However,
If you just have some patience on this pair, we could make over 185 pips!.
Be careful!
I will give updates on this, so don't panic!
TP: 1.31500/1.32500 .

PAYPAL GOING LONG?!PAYPAL HOLDINGS INC.
I believe that we have got an opportunity to go long here guys!
I would get in on this move around the 80.00 Region, up to highs of 83.00/85.00.
After that I would short my position down to the 75.00 Region !
Volume: 9.428M
EPS: 1.64
Market Cap: 94.657B
P/E: 48.83
TP: 83.00/85.00

FACEBOOK! CAN WE GO LONG?I'm actually anticipating a break out of this trend line towards the upside target of 186.00/188.00/192.00.
Now I would only consider getting in on this trade possibly towards the 178.00/180.00 level depending on volume. However I think that a break out on this stock towards our TP's is probable!
Volume: 19.844M
EPS: 6.27
Market Cap: 513.081B
P/E: 28.67
TP: 186.00/188.00/192.00

LONG ON EUR/GBP!I'm anticipating prices to ascend to the upside target of 0.90500/0.91500 which could potentially result in a +280 PIP gain .
I was initially awaiting prices to break the symmetrical triangle in which I entered however we now run the risk of prices going back into the normal range. If this happens worse case scenario, you break even and re - enter however if there's a kiss on the bearish trend line, prices could explode to the upside resulting in a very lucrative position.
TP: 0.90500/0.91500

USD/JPY LONG! 300+ PipsI 'm anticipating a bullish move on USD/JPY. I believe that prices could ascend to highs of 109.000 and also the 111.000 Zone.
Prices could retest our prior resistance level only to spike back down, however don't be discouraged until you know that the trend is definitely going against you. This move could take well over a week to reach our final TP.
TP: 109.000/110.000

LONG ON JOHNSON & JOHNSON?JOHNSON & JOHNSON.
We're currently in a bearish trend, could we go back to the upside?
I believe that we could see some real bullish movement if prices takes out our prior higher high sitting near the 134.00 Region, up to highs of at least 142.00.
TP: 142.00/146.00/148.00
Sector: Healthcare. Pharamaceuticals.
Vol: 1.544M
EPS: 0.47
Market Cap: 351.585B
P/E: 338.94
Div Yield: 2.57%

ADOBE SYSTEMS INC. ADOBE.
Prices are currently searching for resistance. I think prices may continue to surge to highs of 214. If prices break above 208.00 with significant volume we could have some buy opportunity, a real chance to go long. I think that you should be very conservative with your contract size on this trade, regardless if our Target Profit was met I'm anticipating a sharp reversal so you may want to get out and wait for a short position.
However
We could see prices continue and then reverse at the 218 Region.
For now I wouldn't go long pass these two regions.
Vol: 539.745K
EPS: 3.43
Market Cap: 99.781B
P/E: 60.01

BRENT CRUDE OIL! CAN WE ACHIEVE A NEW HIGHER HIGH?Can we achieve a new higher high?
Our current resistance zone is at the 65.00 Area .
I'm anticipating prices to surge pass this area to form new higher highs, around the 66.50 Price Level!
TP : 66.50

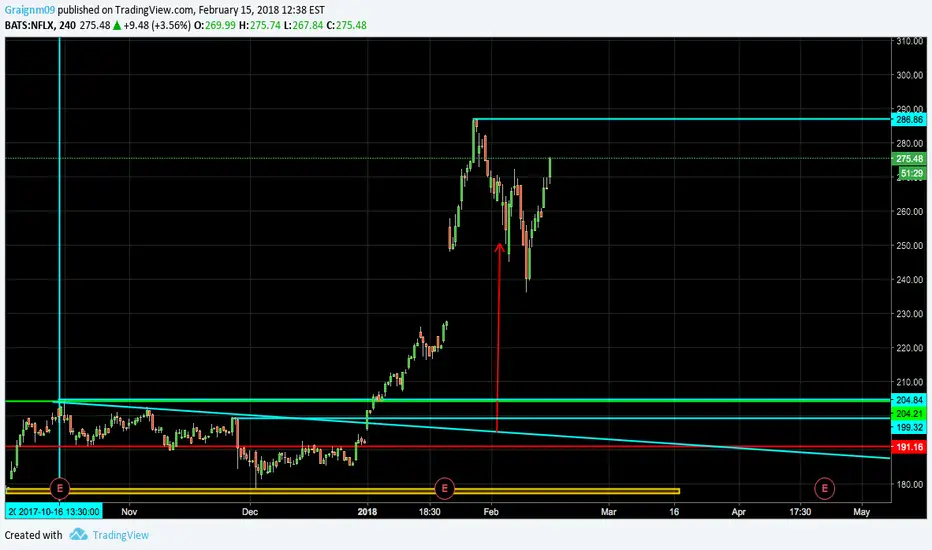
GOING LONG AGAIN ON NETFLIX?My prior target on Netflix was achieved.
Now as prices are now on the rise, I'm anticipating a bullish move up to highs of potentially the 300.00 Price Region.
If prices surpass OUR CURRENT RESISTANCE, I don't see why our target profit cannot be achieved.
TP : 300.00