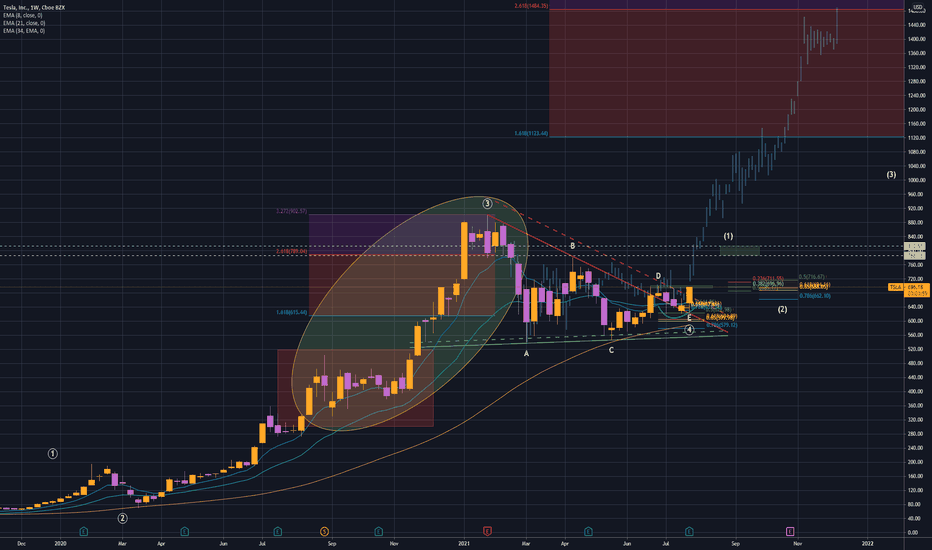
TSLA | It's catch up time!Many stocks have already reached and surpassed their previous ATHs (take AAPL, AMZN, NVDA for example). TSLA has some catching up to do and I believe a close over the $700 level is the first step in the right direction. My projection still stands as it has since first posting about it a few weeks ago. $1000 by end of 2021 is conservative target.
Calls
Big Earnings Might Not Be Enough for AAPLSymbol: NASDAQ:AAPL
Indicators
Laguerre RSI
Multi-Time Frame EMA x2
Thoughts: The technicals are holding up strong despite earnings coming out. The Laguerre RSI is starting to slope down which could be a sell signal. Watching this over the coming days to see how this indicator trends.
PYPL (POSSIBLE LONG ENTRY)PYPL pulling back with most stocks today, I believe this presents a good dip buy opportunity. As long as the fibonacci box shown holds, I expect waves 3, 4 and 5 to occur to complete a set. A move over $310+ will confirm my thesis of the beginnings of sub-wave 3. Target set at $320 with major target at $340.
The Chart Shows Concern for IWMSymbol: AMEX:IWM
Indicators
Laguerre RSI
Multi-Time Frame EMA x2
Thoughts: This chart looks very bearish but I'm hesitant to sound the alarm due to how many topping patterns we seem top gap above. The bullish case for the IWM would be the LagRSI crosses above this bearish zone with a close above the rounded top and confirm the violated trendline as support. Without that, this stock is at risk for falling sharply.
TSLA | Will History Repeat Itself?TSLA reports earnings on Monday, 7/26 after hours. I am making a bold prediction that they will knock it out of the park and gap up 8-10%. Looking from a technical standpoint, the chart is nearly ready to explode upwards and waiting for a catalyst to propel the stock upwards... If we dip, still an amazing buying opportunity in my opinion. Only time will tell...
SNDL GAMMASQUEEZEThe pot boom is finally here. It's time to go up. 270,000,000 shares short, the shills are trying to say the targets are anything but what they are which is super high. 5-10-20-50$ possible. do not miss this 1.
The company has now become a loan shark and multi merger. do not let bears fool you.
MARKET ALPHA VACCINE UPDATE - NVAXNASDAQ:NVAX
We got our pop higher on NVAX but we hit right into resistance. We still have bullish momentum trying to get through this level but if that weakens this could be another trap. This stock has the tendency to be extremely volatile so take your gains when you got them and don't stay in based off hopes and dreams.
S&P Futures Still UncertainAMEX:SPY
S&P futures are rebounding very strong after a huge sell off to start the week.
This has likely caught a lot of people off guard but really shouldn't have with the liquidity flowing into the markets.
We will be watching closely at the next FED meeting to see where we as we discuss further tapering.


