Calls
BUY $GOOGL 1800c 1/15 - Entry 1754, PT 1776, SL 1738 #chartAssuming my entry breaks with volume, and the market is in good shape. I intend on scalping GOOGL from 1754 to 1738. Valid only for January 14th.

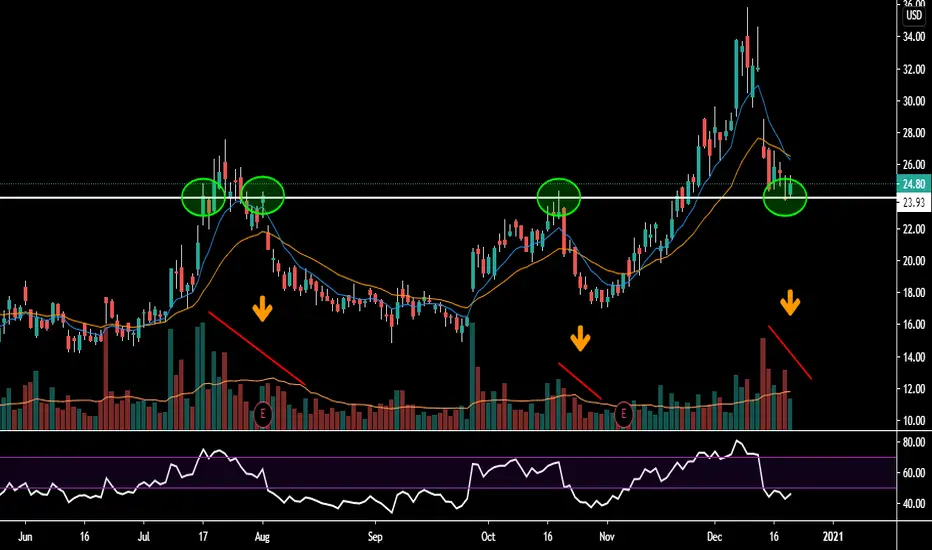
CSCO - Unusual option activity10,467 CSCO 47 strike calls expiring Feb 19th 2021 were traded at 0.89 in a single print above open interest of 1,141.
Since we don't have visibility to what the bid or ask price was when these calls were traded, we have to look at this from different perspectives.
1.) Call Buying - This could be interpreted as call buying since one could argue that CSCO is trying to fill the gap from back on 8/13/2020. Note that the horizontal line representing the 47 strike calls is near the lows on 8/12/2020 just before it gapped down the next day.
2.) Covered Calls - These calls could also be covered calls. CSCO has had a good run from November through present day. Perhaps these are sold calls to hedge against a correction in the stock price.
Let's follow the stock and this option's pricing see what happens.
REMEMBER: Reference to specific securities should not be construed as a recommendation to buy, sell or hold that security. Specific securities are mentioned for educational and informational purposes only. YouCanTrade is an online media publication service which provides investment educational content, ideas and demonstrations, and does not provide investment or trading advice, research or recommendations.

BUY $NVDA 1/15 550c - Entry 544, PT 555, SL 535 #chart I'm looking to scalp NVDA towards 555, if it breaks 544 with volume and the market is in good shape. Valid for January 14th, 2021.

DDOG Symmetrical TriangleNice symmetrical triangle on the weekly chart. If we break up out of the triangle, my targets are $108.69, $118.64, $131.28, and finally, $147.36.
If the pattern breaks down, I'd short below $90 down to the low $70's.

MAJOR AMZN Upside. #BULLISHHad a near $2,000 bull run from March 2020 at a price of $1,600 to $3,550 in September.
Huge symmetrical triangle on the weekly chart signaling another move of the same kind. If we can get a similar move, that'd put Amazon over $5,000 by around August.
I'm INSANELY bullish on AMZN. I'm currently swinging options expiring in 2 weeks, but I'd like to sell to buy an expiration much further out. Bought yesterday on the dip to $3,140.
In addition, I'm hearing rumors of a potential stock split in the coming months. As we've seen with Apple and Tesla, this will make Amazon go CRAZY.

PAYC - Potential Bullish Pivot What's going on traders? Hope you all had a Happy season. Today, we are looking at Paycom Software NYSE:PAYC and it looks as if it had a nice correction in price recently. The stock was trading at a recent high of $471.08 before dropping nearly 13% to 411.13. That area also lines up with previous resistance areas which could be acting as support now. Since then the stock has crossed above the lower Keltner channel (represented by the white dot on the chart) and might be resuming it's trend upward. We will continue to watch PAYC to see if it does move higher over the next few weeks.
REMEMBER: Reference to specific securities should not be construed as a recommendation to buy, sell or hold that security. Specific securities are mentioned for educational and informational purposes only. YouCanTrade is an online media publication service which provides investment educational content, ideas and demonstrations, and does not provide investment or trading advice, research or recommendations.


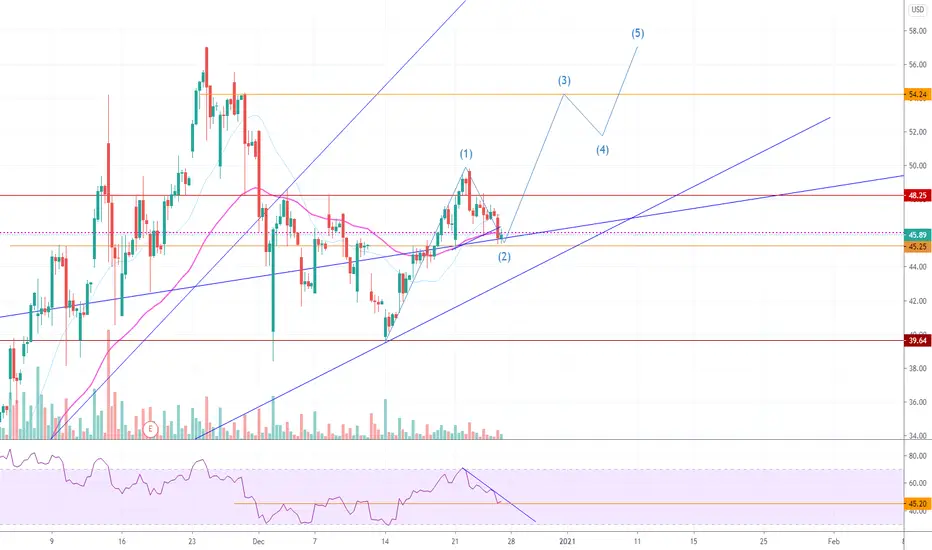
$PLTR - Same price, but with better time targets for optionsThis is basically the same setup i posted last night (early this morning) but fine tuned with an Inside Pitchfork instead of a Modified Schiff. I've also tried to math the EW targets with the fib time targets and the pitchfork targets.
That is to say, i've tried to get a confluence of all 3 types of analysis and reorganized my elliot wave path to land where these three analyses converge. The price targets haven't changed, but the time targets have been modified (usually extended) to give a move conservative layout which will hopefully be useful for options plays. For example in my previous model, the intermediate wave 3 is projected at a target of $39-$40 around Jan 12, where as with this updated model, we have the same price target but on Jan 21. This matches with the median of the new inside pitchfork, and with the 1 extension of the Fib time projection, as opposed to the 0.786 time projection of the previous model.
Im expecting a bounce from the 0.786 retracement, however there is always the possibility of a full retracement to the 100% level and a double bounce from $21. This happened with $Work recently so it's not totally unexpected for a stock that just recently IPO'd and is undergoing its first impulse wave.
This is a better representation of how i intend to play it and is mostly here for my own records. I have Feb 19 $32 calls as well as some #yolo Feb 19 $50 calls. If price falls below $21 i will cut my (significant) losses and move on.


Wayfair Bullish Falling WedgeIf price bounces off support line I will buy on the expectation it will easily hit target 1:$260... If it hits resistance here, sell and take profits however, if there is a strong breakout of resistance line we could see some really nice upside. I am watching closely over the next couple days and will consider buying call options if the right opportunity presents itself.


$AAPL Long via 134 calls see chart, jan 08 21 expiry looking to get long after 3 red days in a row. will update early next week

$AMD PT $95 or $89AMD is forming a symmetrical triangle that should result in a roughly ~3% move to either side. I do spot a very small divergence on RSI telling me there are better odds of this going to the upside to around $95 where it has strong resistance. If that occurs, it appears AMD is forming a HS pattern.
PT $95 or $89 this week.
I will be entering a $90/$95 debit spread expiring Dec 31st.

IWM Bullish LongIWM is an Exchange Traded Fund (ETF) which follows the Russell 2000 Small Cap Stock Index. I purchased call options (just regular, no spread) Strike 200 expiring Jan 2022 because I belive IWM has shown consistent bull market uptrend since November, and consistently uses the 10 Day Exponential Moving Average (EMA) as Support. IWM has shown better consistency, in my opinion, than SPY (ETF following S&P 500), and while QQQ (ETF that follows the Nasdaq 100 index) has outperformed most other major indexes in the past few years, IWM's lower prices made it more attractive to me. The growth may be slower than some other indexes; but as my first trading teacher stated, "You don't go broke making money." This may be a boring strategy, but I believe it will still be a profitable one. My stop loss plan is set below the 20 Day EMA. The yellow dotted line is the approximate price per share of stock when I purchased my calls earlier today.
I am not certified or licensed by any individual or institution to give financial or investment advice. I consider myself to be an amateur investor and trader.

SPCE Possible ReversalSPCE showing signs of a possible reversal. Gathering/consolidating support along a previous significant resistance level. Volume has typically tapered lower during downtrend which we currently see. High risk play entering right now, I'd like to see more confirmation first before entering (RSI divergence along lows or break of pinbar printed on 11/30.
Heavy eyes on the 1/15/21 $25c and $30c. Volume seems to be focused there.
Leave a comment to discuss!!!
SBUX Ready To PopSBUX has done well holding support at the 8 EMA consistently since mid November. Lower trend line still intact, price appears to be compressed into the apex of the triangle. Love the volume spikes with the spinning top on Friday. This is a tug o' war with buyers and sellers.
Odds are in buyers favor due to uptrend. Options market leans to the call side as 1/15/21 $105c shows more significant volume/OI. Eyes on this one!!!
Let me know your thoughts!!!

How to Play TeslaTesla was heading towards the lower bound range of this channel on Friday, then snapped back up in final trading hours. I am going to look for an entry point around the $635-$655 range and buy the 740 calls in mid January.

CRM Breakout Levels with TrendlinesWe can see that CRM is in a good buying area as it broke under the trend lines but still stayed on the positive side of the 208 to 229 level. My levels show over 229.11 has 237.11, will then follow trend line over 248.24 levels and can push towards 260.70. I like this long, currently entered in 1/8 230c @3.60. NYSE:CRM

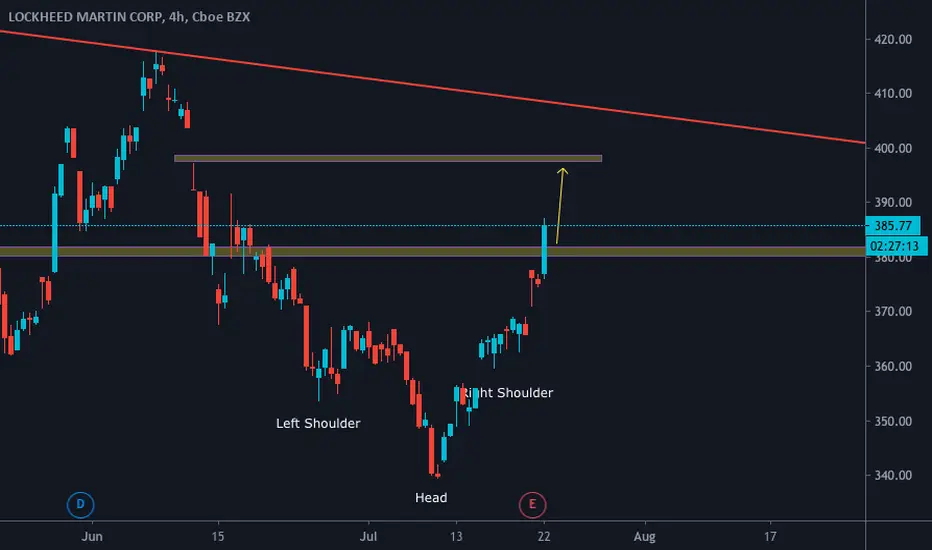
initiated a call 18/06/2021 20 @ 2,64 18.20 WAS EXACTLY THE POINT THE STOCK REBOUNDED THE LAST TIME IT COLLAPSED , hence a strong support at the 18 line
I am betting it is the same story again
Not an investment advise

$CRM - Calls Above ~ 229.6 Salesforce took a pretty big hit after announcing the WORK (slack) buyout. It's clear the price has stabilized and is looking to climb again. My favourite ETF, ARKK has also purchased a bunch of CRM at this bargain price. I'm looking to takes calls or buy shares when the price closes above the 229.6 region, which seems to be where the accumulation wall is. I'm targeting to fill just below the gap at around 236.
