When You Bought the Farm: PLTR, BRB, CALM, ROBLOX, ADMA, PLMRI am not in a market for super stocks in this environment at the moment. Also, I am looking beyond the trade war and into quality companies:
Fundamentals:
Warren Buffet says, "When you bought the farm, you looked at what the farm would produce".... "...the potential of the farm"..."You don't need a quote on it."
PLTR's May 14, 2024 Investment Update for April 21, 2025:
See the following chart. Fundamentals are still good:
(BellRing Brands, Inc.) BRBR - think protein bars and shakes: A recent investment:
Cal-Maine Foods (CALM): Speaking of farms and chicken eggs! Cal-Maine Foods is "the largest producer and distributor of fresh shell eggs in the United States, committed to offering our customers a wide range of quality egg and egg product choices produced in a safe, cost-effective and sustainable manner." (www.calmainefoods.com). It has good ROE and the quality of institutional investment has steadily grown legs into this company. It meets basic parameters of an investment.
ROBLOX (RBLX): I did my own personally survey and contacted several hundred of family and friends from the globe, and not only are Gen-Z playing ROBLOX, but even young adults are into it. It is true that with its immersive platform, "every day, millions of people come to Roblox to create, play, and connect with each other in experiences built by our global community of creators." Another company that I mentioned is Take-Two (TTWO) with Grand Theft Auto 6 coming out around August or September 2025 this year, I think it also will continue to surprise and do well. I shall invest in both; however, I like ROBLOX better.
I mentioned other companies in the video that are minor investments and the technical aspects of entry: Marex Group (MRX), Palomar Holdings (PLMR) and ADMA.
CALM

CALM Cal-Maine Foods Options Ahead of EarningsIf you haven`t bought CAL before the previous earnings:
Now analyzing the options chain and the chart patterns of CALM Cal-Maine Foods prior to the earnings report this week,
I would consider purchasing the 75usd strike price Puts with
an expiration date of 2025-5-16,
for a premium of approximately $7.75.
If these options prove to be profitable prior to the earnings release, I would sell at least half of them.

CALM Cal-Maine Foods Options Ahead of EarningsAnalyzing the options chain and the chart patterns of CALM Cal-Maine Foods prior to the earnings report this week,
I would consider purchasing the 60usd strike price Calls with
an expiration date of 2024-4-19,
for a premium of approximately $1.47.
If these options prove to be profitable prior to the earnings release, I would sell at least half of them.

CALM Cal-Maine Foods Options Ahead of EarningsIf you haven`t sold CALM here:
Then analyzing the options chain and the chart patterns of CALM Cal-Maine Foods prior to the earnings report this week,
I would consider purchasing the 45usd strike price Puts with
an expiration date of 2023-12-15,
for a premium of approximately $1.35.
If these options prove to be profitable prior to the earnings release, I would sell at least half of them.
Looking forward to read your opinion about it.

SPX: Watch These Stocks to CASH IN on EGGS 🥚Hi Traders, Investors and Speculators of the Charts 📈📉
The SPX Chart is looking bullish as we see another very clear pattern form - the higher lows. Previously, this has been a sign that we can expect more upside movement from the stock market. But not all stocks are equal during this time... Have you bought some eggs recently?
Forget high gas prices. If you've tried to buy eggs lately, you've paid up or done without. But some investors are finding a way to cash in. Shares of one of the largest publicly traded egg producers, Cal-Maine (CALM) is up 39% in past 12 months. That's impressive as while the S&P 500 was down more than 7% during that time. Egg prices are on fire — even more so than oil. The price of a dozen grade-A eggs was $4.25 nationally in December 2022, says the Bureau of Labor Statistics, up 138% from the same period a year ago. In some places, like California, eggs sell for even more.
Egg prices are becoming the new face for runaway inflation. Millions of hens died last year in an outbreak of disease. That sharply cut the supply of eggs. Cal-Maine is even considered a meme stock now, landing in the Roundhill Meme ETF (MEME). The avian flu's effect on supply will ease, analysts say. But investors who look closely will see that corporate profits at egg companies are booming, too. And that's not seen easing anytime soon.
"Energy prices fell 4.5% in December on a 9.4% decline in gasoline prices. Food prices rose 0.3%, with food at home up 0.2% and food away from home up 0.4%, " said Bill Adams, chief economist for Comerica Bank. "Egg prices rose 11.1% on the month, pushed higher by an avian flu outbreak that has hurt supply."
So when you're ready to cough up the big bucks to buy eggs, at least know there's a way to profit, too.
HEY👀 Interested in Bitcoin? Here's my take for the SHORT TERM :
_______________________
📢Follow us here on TradingView for daily updates and trade ideas on crypto , stocks and commodities 💎Hit like & Follow 👍
We thank you for your support !
CryptoCheck

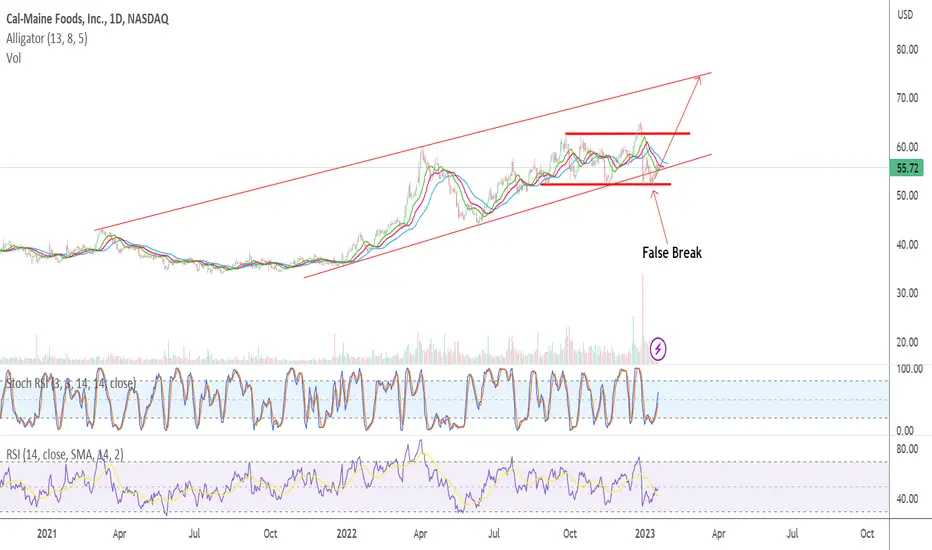
CALMIf the break down was in fact false, this could continue its trend up towards the $70 area.
This is simply perspective and not financial advise.
GBPUSD daily forecastBe calm, cool and Look at the market drop. Although its the evening but this is an amazing opportunity. I defined by 2 words capital and opportunity so I am capitalising on this opportunity

GBPUSD daily forecastA beautiful morining, lets be greatful for every opportunity the market has given. Everyday, all the time we get opportunities to learn, grow and profit. Have a lovely day everyone.

GBPUSD daily forecastIts a beautiful day, thank you for sunshine, thank you for rain, thank you for joy and thank you for pain, its a profitable dayayayayay

GBPUSD daily forecastIts a beautiful morning in the new year. let's profit on the beauty of the markets. lets be one with the market and flow with the tides.

GBPUSD daily forecastGood morning everyone. I hope you are enjoying your festive season as I am doing so. Rise and shine with the makets and lets accumulate our profits.

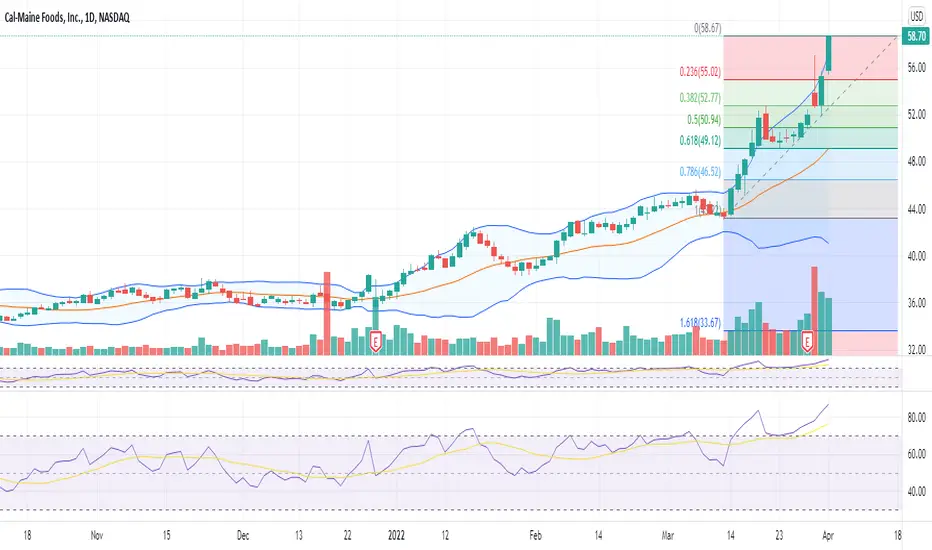
CALM Cal-Maine Foods Options Ahead Of EarningsAfter the last price target was reached:
Now looking at the CALM Cal-Maine Foods options chain ahead of earnings , i would buy the $60 strike price Calls with
2023-1-20 expiration date for about
$5.70 premium.
If the options turn out to be profitable Before the earnings release, i would sell at least 50%.
Looking forward to read your opinion about it.

GBPUSD daily forecastGood morning everyone. I hope you are doing well. Let's rise with the tides of the markets. Have an amazing day filled with profits.

GBPUSD daily forecastRise and shine beautiful people. The market markets are looking bullish this morning. Lets ride these bulls and make some green. Have a wonderful day.

GBPUSD daily forecastGood morning everyone. Lets rise with price as the sun rises. Have a lovely day <3.

GBPUSD daily forecastGood morning everyone. I hope you has a great day yesterday. It's Friday morning and its about to go down. Have a nice day everyone <3

GBPUSD daily forecastGood morning everyone. The markets are looing bearing today thus I am looking for sells.

CALM Cal-Maine Foods Options Ahead Of EarningsLooking at the CALM Cal-Maine Foods options chain, i would buy the $55 strike price Puts with
2022-11-18 expiration date for about
$1.65 premium.
Looking forward to read your opinion about it.

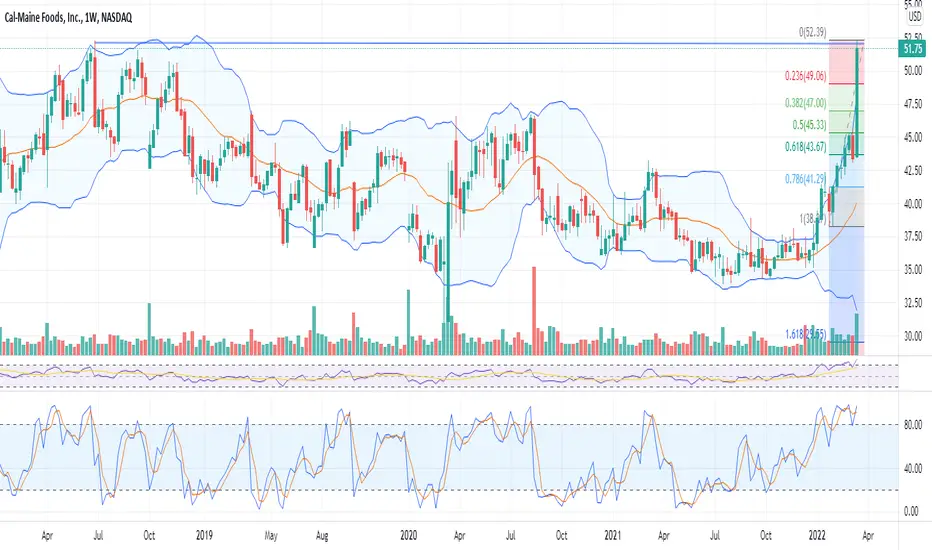
Long term play: Cal-Maine Foods (CALM)CALM held up very well in this correction thus far and reported strong earnings this week.
Potentially breaking out on the monthly and a confirmed breakout on the weekly based on last week's action.

CALM overbought again back in this tradeI am back in this trade a second time in about a week. Last time I bought puts which doubled on the drop. This time I am shorting the common stock and will add as price increases for a nice average. 1,000 shares short $58.10 will add every $1.50 increase equal number of shares. Way overbought and getting ahead of itself. I will also buy puts in the $60's
Crappy days+ Top author!Before we start, I would like to brag about becoming a TOP AUTHOR! You can check by going to the ideas tab and typing in MULN, switch to All time authors, and you'll see me! Anyway let's get into it, we've seen some bad days the past few, well, days, and it's not good, but stay calm folks, I have an explanation. The price went Sky-High a few days ago, and now people are selling out. Once the sell outs are finished and the price drops, (insert sound effect here) the price goes up again. will it break $5 by then end of this week? Unlikely, but by the end of April, it could AVERAGE that. stay tuned and stay calmed. (Is that a word? Calmed?)

CALM way overbought double topLikely a failed double top way overbought on technicals this stock is due for a pullback $45 or under
Uncle Ryan Presents: CALM Bullish DivergenceA large base has presented a bullish divergence as a harmonic deep crab completes above the reclaimed 50 SMA support.
